3D microstructural characterization of nanoindentation deformation fields
- Abstract number
- 1039
- Event
- European Microscopy Congress 2020
- DOI
- 10.22443/rms.emc2020.1039
- Corresponding Email
- [email protected]
- Session
- PSA.2 - Metals & Alloys
- Authors
- Dr Laurie Palasse (1), Dr Jaroslav Lukeš (2)
- Affiliations
-
1. Bruker Nano Analytics
2. Bruker Nano Surfaces - Hysitron
- Keywords
EBSD, mechanical response, nanoindentation, strain localization
- Abstract text
In this study, we present 3D microstructural characterization of deformation fields produced by nanoindentation on commonly used alloys. The material’s mechanical response was investigated using SEM in-situ nanomechanical testing and 3D EBSD techniques.
The development of advanced materials of high yield strength and high ductility requires a good understanding on the mechanical behavior of these materials. Because plastic deformation and strengthening mechanisms occurs at sub-microscopic scale, in-situ nanomechanical testing system in SEM is the preferred technique to provide insights down to the nanoscale. It enables the direct observation of these mechanisms and can measure the hardness and elastic modulus of the material.
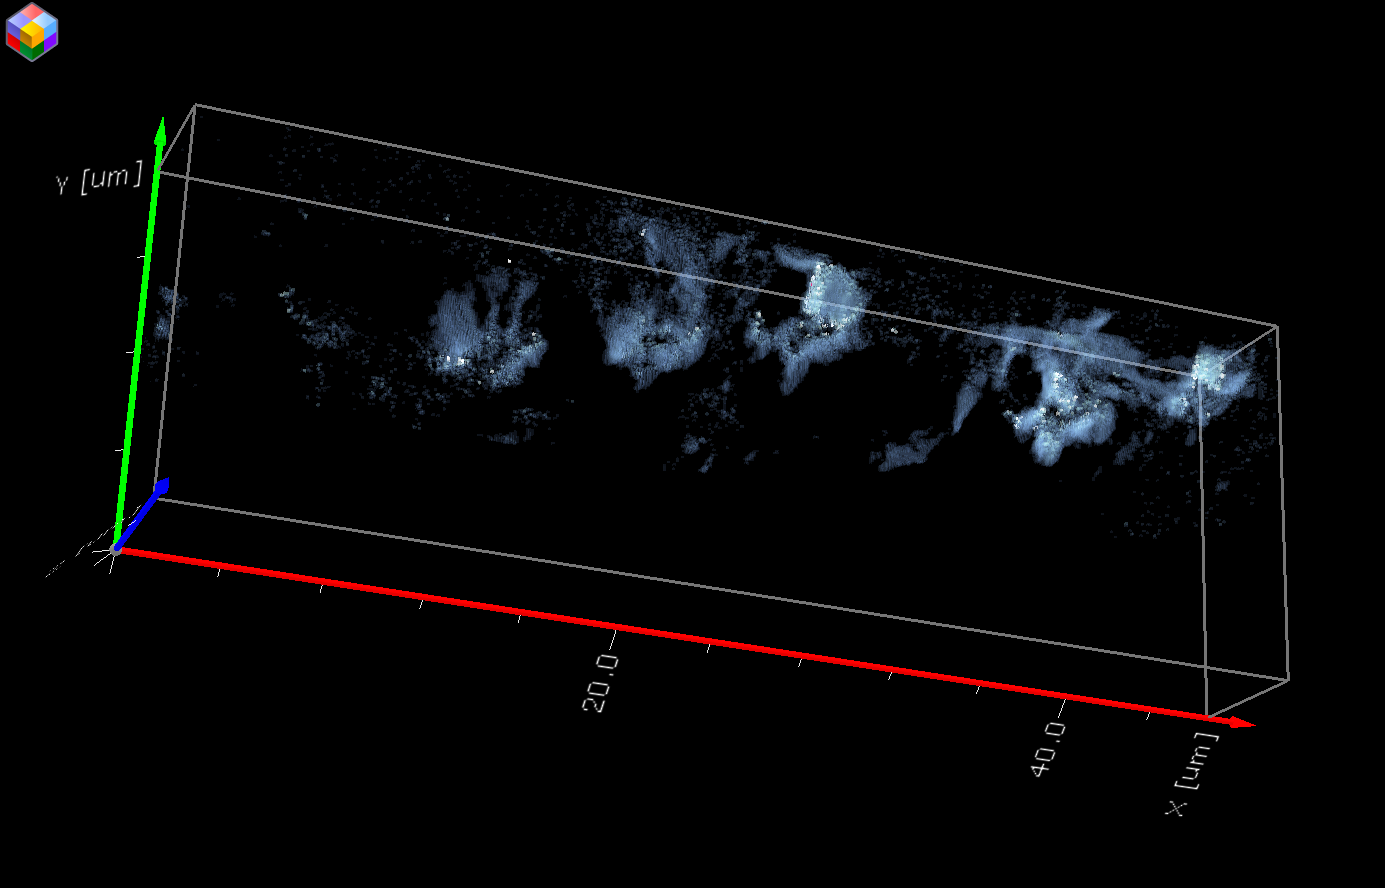
In-situ nanomechanical testing was performed in a FIB-SEM using a PI 88 SEM PicoIndenter® and real-time SEM imaging. High resolution 3D EBSD measurements were subsequently made by combining serial sectioning with EBSD measurement on series of indents placed with varying loads. We therefore measure and relate the material’s mechanical response with local crystallographic orientation changes in microstructure, such as the generation and movement of dislocations. 3D EBSD data were reconstructed using ESPRIT QUBE software, enabling the 3D mapping of the strain localization (see figure 1 for the results on stainless steel), including geometrically necessary dislocations [1].
A deeper understanding of a material’s mechanical response is possible thanks to correlative studies using in-situ nanoindentation and 3D EBSD techniques. Thereby characterizing the deformation fields over few tens of microns in 3 dimensions.
Figure 1: 3D Local average disorientation (LAD) results from an area of 5 nanoindents applied on an austenitic steel sample. LAD distribution from 0° (in blue) to 5° (in red).
- References
[1] Konijnenberg P., et al. (2015). Assessment of geometrically necessary dislocation levels derived by 3D EBSD, Acta Materialia, 99, 402-414.