Atomic structure of the (001) surface of CeO2 nanocubes as revealed by high resolution imaging under oxygen in an ETEM
- Abstract number
- 1420
- Event
- European Microscopy Congress 2020
- DOI
- 10.22443/rms.emc2020.1420
- Corresponding Email
- [email protected]
- Session
- PST.6 - In-situ and in-operando microscopy
- Authors
- Dr. Thierry Epicier (2, 3), Dr. Olivier Matz (1), Dr. Monica Calatayud-Antonino (1), Dr. Matthieu Bugnet (2)
- Affiliations
-
1. Sorbonne Université, UPMC Univ Paris 06, CNRS, Laboratoire de Chimie Théorique
2. University Lyon, INSA-Lyon, UCBL, MATEIS, UMR CNRS 5510, CLYM
3. University Lyon, UCBL, IRCELYON, UMR CNRS 5256, CLYM
- Keywords
Atomic structure, Catalyst, Ceria, Environmental TEM, High Resolution EM, Operando microscopy
- Abstract text
Understanding the atomic structure of the surface of a material in a given environment is a prerequisite for the optimization of their functional properties for a large of applications, among which catalysis plays an important role in the current context of energy transition and sustainable development. With the availability of modern aberration-corrected transmission electron microscopes (TEM) dedicated to environmental observations of nanomaterials under a controlled gaseous environment, observing directly the interaction of gas molecules with solid surfaces becomes possible at atomic resolution. Such environmental instruments (ETEMs) do only offer the possibility of observing materials under a low partial pressure, typically up to 20 mbar as it is possible today in the 300 kV FEI Titan ETEM used in this work. This background pressure is much less than what can be obtained in a close (or environmental) cell (Ecell) where the object of interest is sandwiched between two thin membranes, generally made of SiNx, and thus kept up to atmospheric pressure. Despite this limitation, ETEM offers a better sensitivity for detecting light atoms since sealing membranes are not required to permit a non-vacuum environment.
Accordingly, absorption of CO molecules on a (001) Au surface was first investigated under dilute CO in air at 100 Pa [1]. Very recently, the interaction of water molecules on (001) TiO2 was evidenced during the investigation of the water gas shift reaction in situ at 700°C [2]. In our previous work, we investigated the mobility of the cerium cations at the {100} surfaces of ceria (CeO2) nanocubes under different atmospheres, e.g. high vacuum, O2 or CO2 environments in the mbar and sub-mbar range [3]. Interestingly, the high atomic mobility that can be measured for both oxygen and cerium atoms under high vacuum is blocked when ceria is examined in an oxygen pressure, even for partial pressures as low as ~10-2 mbar. Indeed, oxygen from the gas molecules fill surface oxygen vacancies created by the electron beam, which induce the observed Ce mobility under high vacuum. It can then be considered that ETEM provides a mean to investigate a quasi-stable structure of the {001} surfaces, and comparison with atomistic, e.g. density functional theory (DFT) calculations become then possible and relevant.
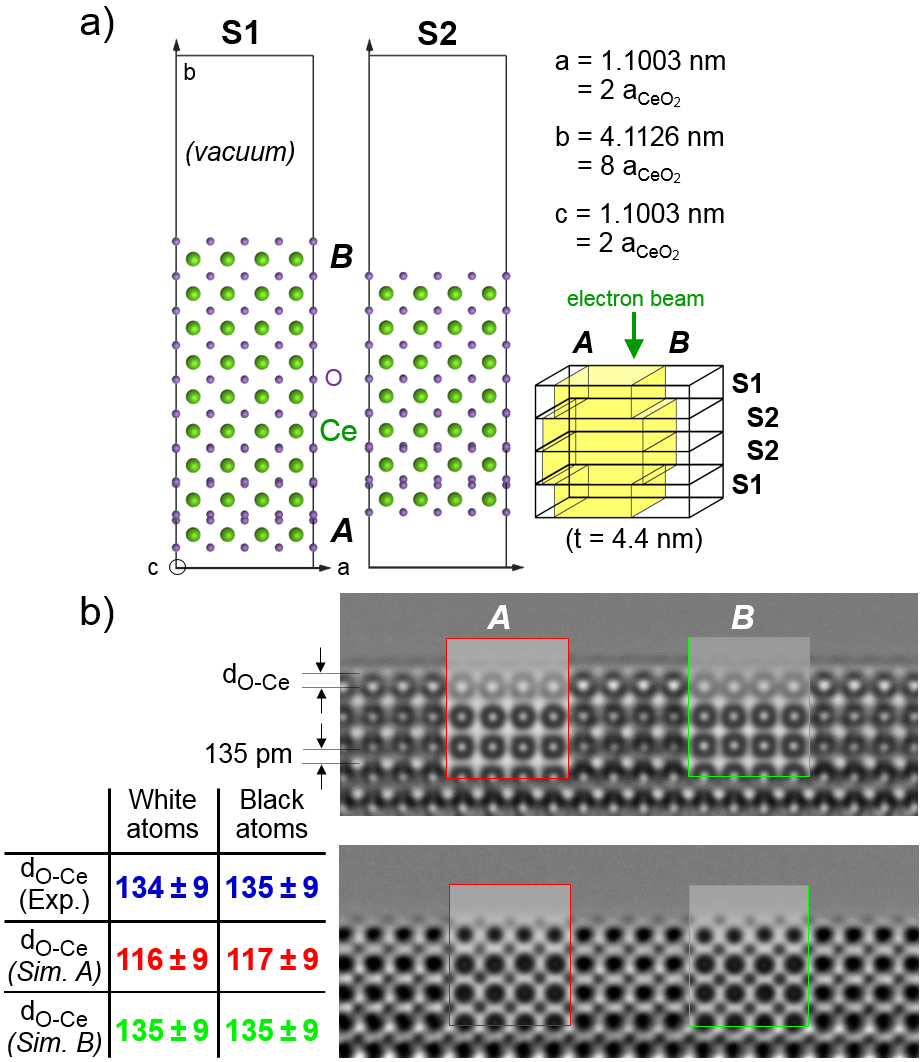
We have then run extensive high resolution TEM (HRTEM) image simulations based on DFT models [4], see figure 1a). The java electron microscope simulation (JEMS) software suite from P. Stadelmann [5] was used, and care was taken to acquire both white- (reverse-contrast) and black-atoms experimental images from thin terraces as seen edge-on at the edges of ceria nanocubes for a better quantification. In fact, surface terraces are found to be almost systematically present on the {100} facets of the nanocubes, and they have been considered according to the supercell models shown in fig. 1a) in order to improve the match between experimental and simulated images.
The quality of the models is visually verified by properly adjusting the contrast of the sub-surfaces atomic layers of both Ce and O columns. As a typical feature, it can be seen that about two unit cell planes below the surface in the bulk part of ceria, the white atoms micrograph in figure 1b) exhibits O columns larger than Ce columns, as confirmed in the simulation. The main conclusion that can be deduced from this work is that the surface distance between the terminating oxygen layer and the first Ce layer beneath (noted dO-Ce in fig. 1b) is underestimated in both images with black and white type atomic contrasts and calculated from the DFT model. Further DFT calculations taking into account the possible influence of residual hydrogen and hydroxyl bonding groups at the surface could influence the dO-Ce distance and may lead to a better agreement with what is measured from the experimental micrographs. These features, as well as others like the surface coverage, will then be discussed [6].
Figure 1: HRTEM experimental and simulated images of O-terminated (001) ceria surfaces as observed under 10-1 mbar of oxygen at room temperature. a): construction of adequate JEMS supercells enabling to simulate two surface models at once owing to the periodic continuation imposed by the multislice algorithm. Surface (or interface ceria-vacuum) model A is built according to DFT simulations; model B corresponds to an unrelaxed oxygen terminating layer. Two supercells S1 and S2 are used in order to reproduce the presence of edge-on terraces as shown by the indicative sequence S1 S2 S2 S1 (4 nm thick). b): comparison of simulations from A and B models with experimental micrographs of (001) surfaces in reverse and ‘Scherzer’-like (black) contrasts (respectively top and bottom images). The table reports the values in pm of the distances of O-Ce layers at the surface. Simulations correspond to a thickness of 4.4 nm, a Cs value corrected to 0.03 mm and defoci respectively equal to -3 and +9 nm for top and bottom images (JEMS sign convention).
- References
[1] H. Yoshida et al. Science 335, (2012) 317.
[2] W. Yuan et al., Science 367, (2020) 428.
[3] M. Bugnet et al., Nano Letters 17, (2017) 7652.
[4] O. Matz, M. Calatayud, ACS Omega 3, (2018) 16063.
[5] website www.jems-saas.ch.
[6] The ETEM work was performed at the Consortium Lyon-St-Etienne de Microscopie (CLYM, www.clym.fr). M.B. and T.E. acknowledge Z. Wu from ORNL lab., USA for providing samples.