C-means clustering of combined EDS and EBSD signals for materials analysis
- Abstract number
- 1087
- Event
- European Microscopy Congress 2020
- DOI
- 10.22443/rms.emc2020.1087
- Corresponding Email
- [email protected]
- Session
- DHA.3 - Machine assisted acquisition and analysis of microscopy data
- Authors
- Dr Alexander Eggeman (3), Dr Joshua Einsle (2), Dr Benjamin Martineau (1), Dr Zoia Vukmanovic (1), Dr Giulio Lampronti (1), Prof Richard Harrison (1), Prof Paul Midgley (1)
- Affiliations
-
1. University of Cambridge
2. University of Glasgow
3. University of Manchester
- Keywords
EBDS, EDS, Fuzzy clustering, mineralogy
- Abstract text
Summary
Fuzzy C-means clustering was used to determine the phase distribution in a complex mineralogical sample based on a combination of simultaneous structural (EBSD) and compositional (EDS) measurements. The analysis shows how the combination of the two different measurements allows a far greater discrimination of the microstructure components than either measurement alone, particularly in the case of two different solid solutions (augite-pigeonite and anorthite-bytownite) which exhibit very similar chemical composition and grew by spinodal decomposition resulting in strong crystallographic coherency. Metrics to determine the correct scaling of the two signals are also proposed.
Introduction
The application of data-science to characterisation methods has increased greatly in recent years [1]. A central idea is that machine learning approaches can interrogate the large quantities of data produced by automated experiments and so improve the characterisation of phases, orientations, distortions or defects in microstructures.
One such approach is fuzzy c-means clustering that seeks to group particular measurements with other 'like-measurements' compared to unlike-measurements. The key difference to other unsupervised methods is that this approach returns a membership score for each measurement for each cluster; so outliers or interface points can be easily determined and their influence on the cluster centre can be more realistically considered. Proof-of-principle studies [2] show that this can discriminate different microstructure components based on a diffraction signal alone, however there are situations where structural similarities require additional information to fully characterise the microstructure. A spectroscopic signal was introduced to provide greater sensitivity to the microstructure components.
Methods/Materials
Simultaneous electron back-scattered diffraction (EBSD) and energy-dispersive x-ray spectroscopy (EDS) were performed on a symplectite sample comprising 4 different phases in two different solid solutions. The combined data structure consists of 21,456 correlated measurements (144 by 149 scan positions), where each pixel consists of 2048 spectral channels combined with a 45px by 45px EBSD pattern. Principal component analysis (PCA) step is initially performed to reduce the dimensionality of the problem to 10 abstract factors. In this new 10-dimensional data space a conventional distance metric could be calculated. The fuzzy C-means approach allows for a probabilistic interpretation on this abstract data. The resulting cluster centres are projected back onto the original data for quantification and analysis.
Results and Discussion
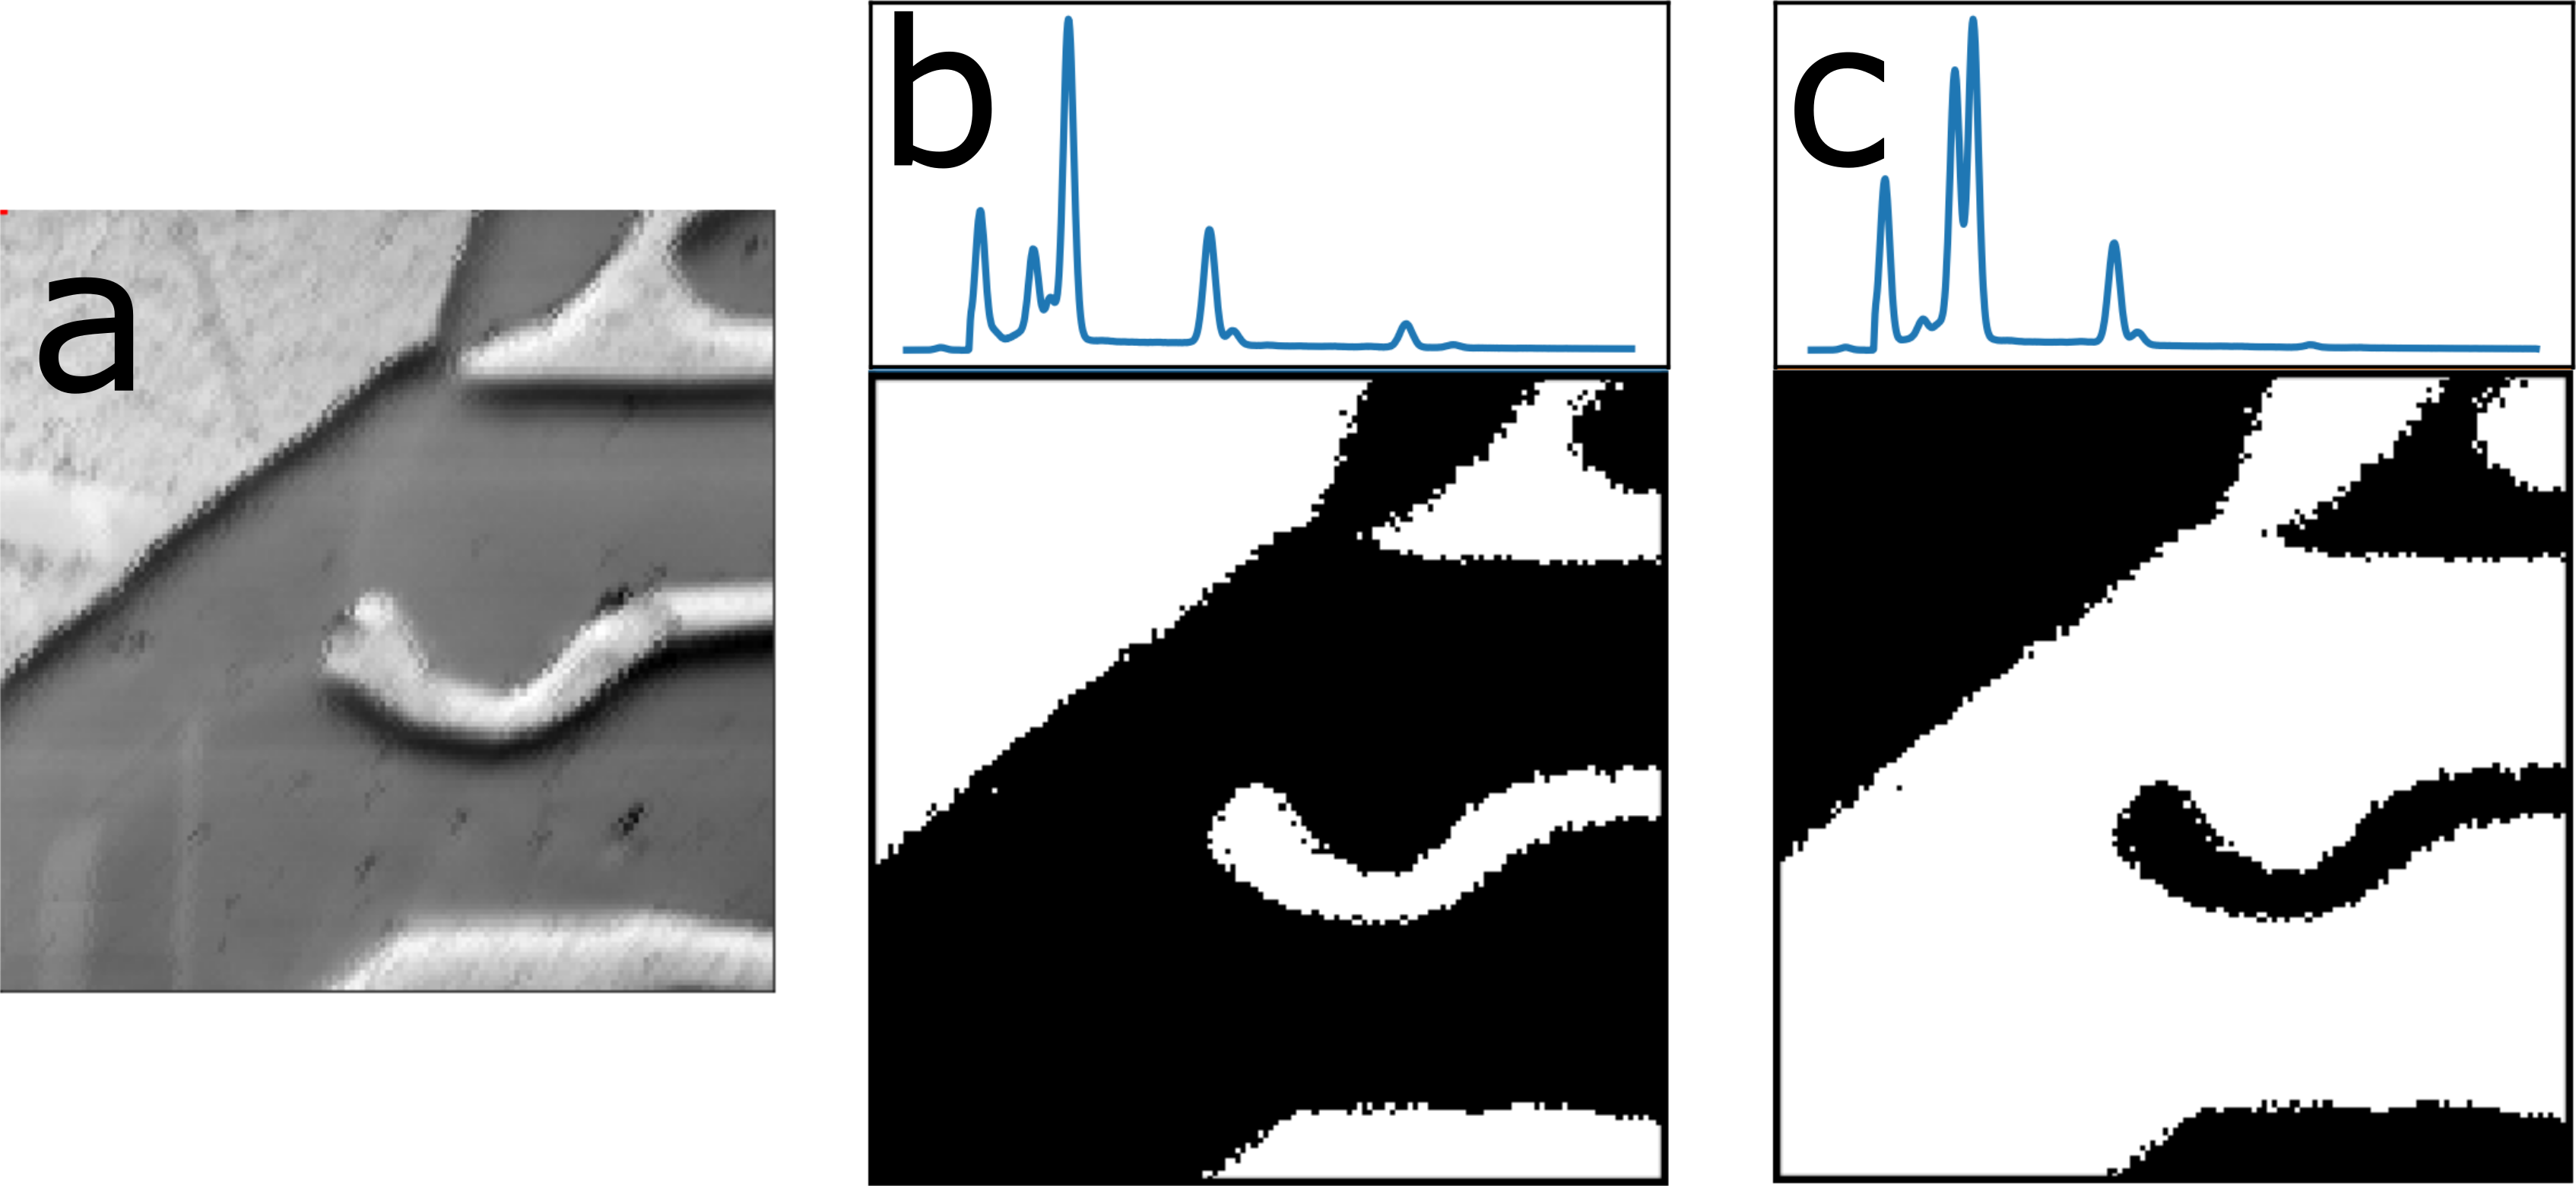
The general structure of the sample under scrutiny can be seen from a map of the integrated EBSD signal shown in Figure 1a. Comparing this with the C-means results from the EDS signal, only 2 clusters could be determined with points with greater than 50% membership (which can be unambiguously attributed to a specific cluster) and these are shown in Figures 1b and 1c. There would appear to be 2 distinct phases in the sample based on the distribution of compositions.
Figure 1a. Integrated EBSD signal from the symplectite region. b) and c) the C-means analysis of the EDS signals from the sample. The region clearly partitions into two distinct compositions
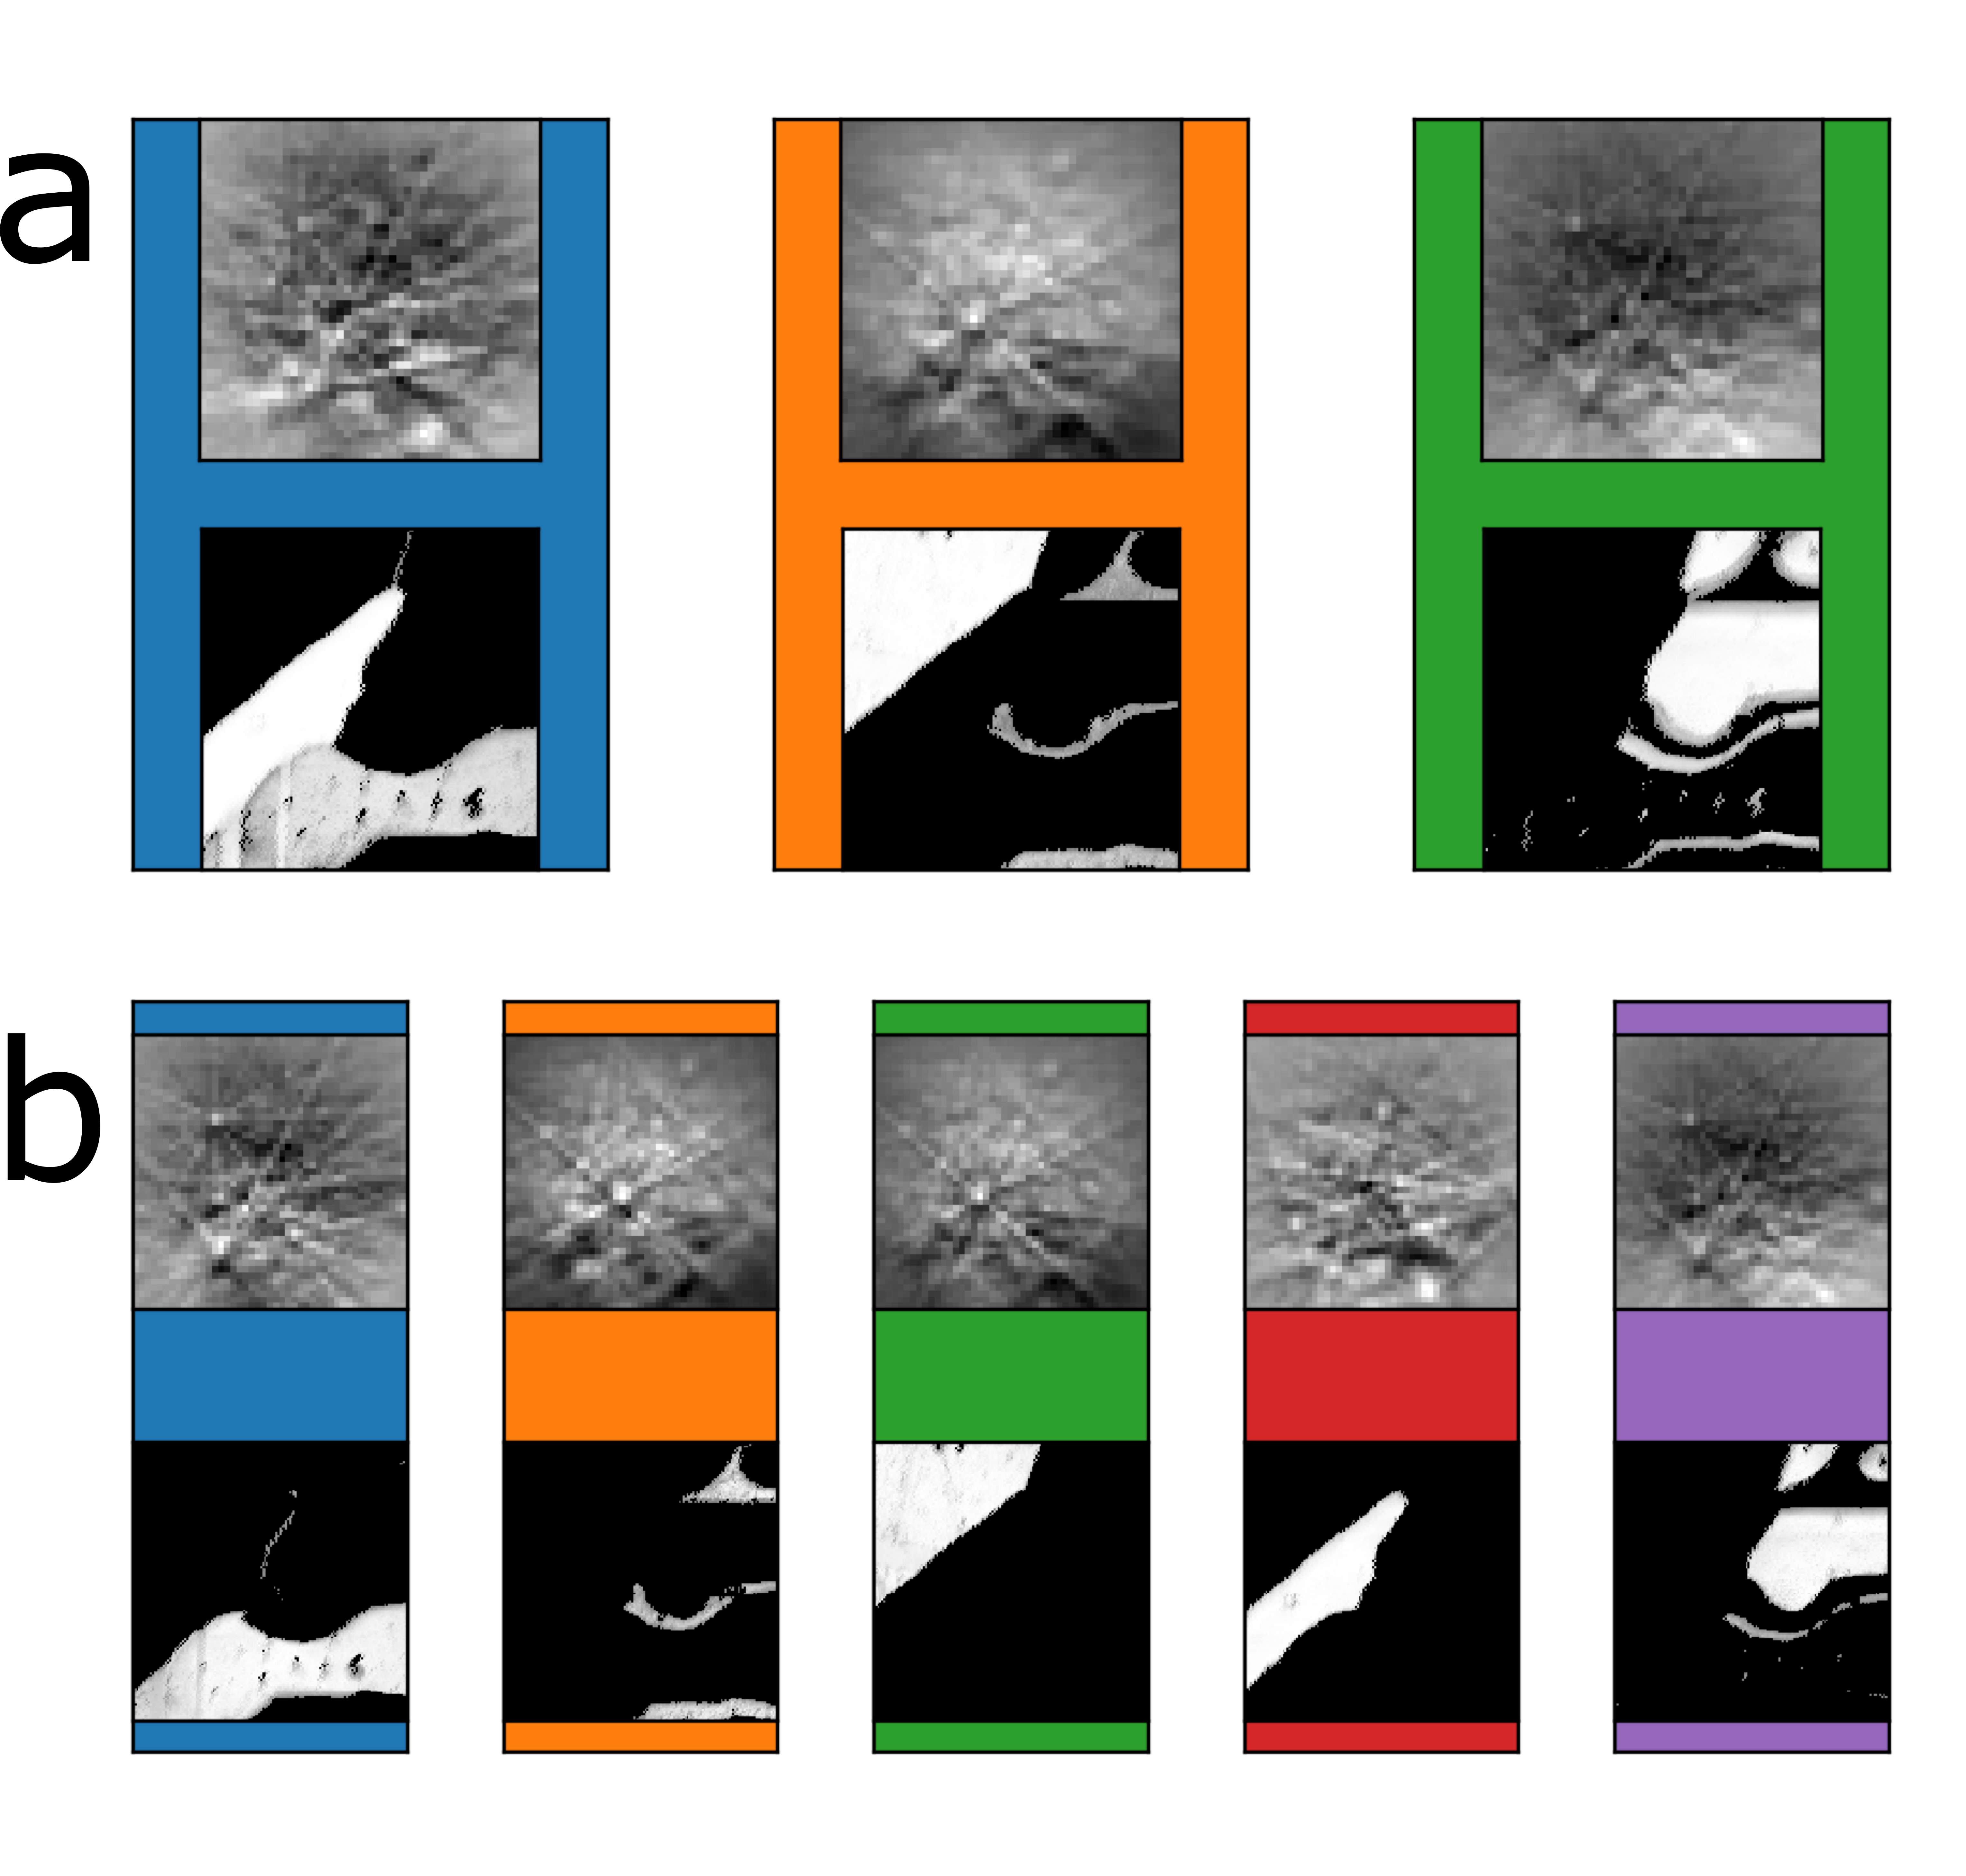
Figure 2 shows the results from C-means analysis of the EBSD data alone. Based on the requirement to classify every point in the scan there would appear to be either 3 (Figure 2a) or 5 (Figure 2b) distinct structural regions (4 clusters did not classify large regions of the scan). In the 3-cluster solution the first EDS cluster remains unperturbed while the second seems to split into two distinctly oriented groups. In the 5 cluster solution then for each chemical composition one of the groups splits into two regions with a small deviation in orientation.
Figure 2. C-means analysis of the EBSD signal, both 3 and 5 cluster results describe the majority of the scan areas.
To determine the correct number of clusters in the microstructure, the C-means analysis was performed on the combined EDS and EBSD signals. This allows distinctions not visible in either signal to be uncovered and through the co-variation in this combined data. The initial stage required suitable scaling of the factors. While a scree-plot analysis was initially considered (in line with conventional PCA analysis) this proved to be less useful than a comparison of the PCA factors for the joint decomposition. Ideally the factors should have a contribution from both the EDS and EBSD if they are to highlight subtle co-variance between the two channels. Hence a sum of the absolute values was calculated for each factor, since PCA factors tend to define variance from the mean so have an average value close to zero. If the EDS signal was too significant then the factor tended towards a very low value (spectra being sparse) whereas too great a weighting for the EBSD tended to produce a constant value as the PCA factors were identical. A narrow range of scaling factors could thus be identified where a transition between these regimes occurred and these could be tested to find a suitable output.
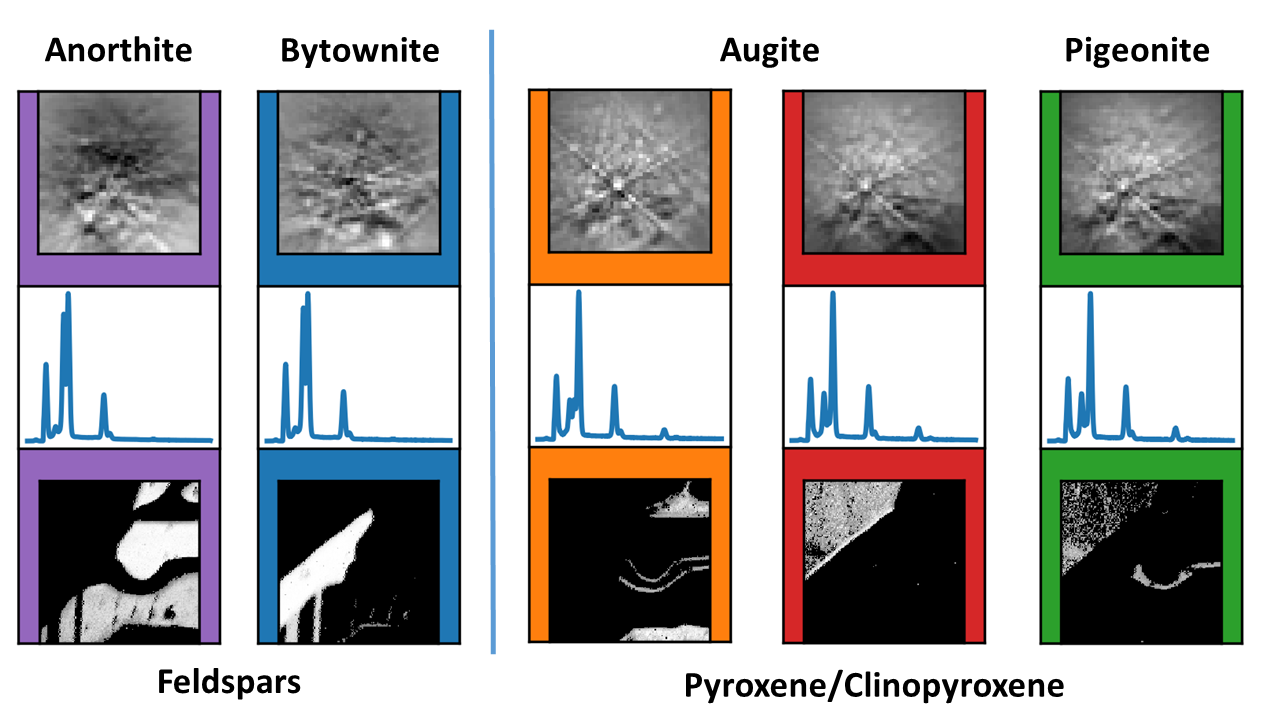
The results in Figure 3 show how a correctly combined and weighted dataset allows identification of 5 clusters in the data but with additional microstructural differences compared to the EBSD analysis. In one case this is the correct association of a set of parallel intergrowths in the lower left region of the area indicating the transformation from the parent bytownite to anorthite. Also, the identification of the coexistence of two different phases (augite and pigeonite) within the grains of one of the solid solution systems (comprising for example regions within the upper left grain). This distribution of distinct phases and the cluster centres allowed all 4 phases to then be identified by manual segmentation, using a non-arbitrary criterion for unique cluster membership.
Figure 3. C-means analysis of the combined signals, showing 5 chemically and structurally distinct microstructure components classsified as 4 phases.
Conclusion
The use of different measurements of can provide new insight into the details of the microstructure of materials. Combining the signals requires understanding of the data and analysis method but with care additional information can be extracted that would not be achievable from isolated signals. Determining the correct number and distribution of phases is essential for accurate segmentation of any such data.
- References
[1] Thomas, J.M., et al. Chem. Phys. Lett. 631, (2015) p 103–113 . Doi: 10.1016/j.cplett.2015.04.048
[2] Martineau, B. H. et al. Adv Struct Chem Imag 5, (2019) p 3. Doi: 10.1186/s40679-019-0063-3