Ceria-supported nickel catalyst for Sabatier reaction: a detailed nanoscopy investigation
- Abstract number
- 658
- Event
- Virtual Early Career European Microscopy Congress 2020
- Presentation Form
- Submitted Poster
- DOI
- 10.22443/rms.emc2020.658
- Corresponding Email
- [email protected]
- Session
- PSA.5 - Nanoparticles & Catalysts
- Authors
- Dr Maria Chiara Spadaro (1), Ms Viktoria Holovanova (2), Dr Teresa Andreu (2), Prof Dr Joan Ramon Morante (2), Prof Dr Jordi Arbiol (1)
- Affiliations
-
1. Catalan Institute of Nanoscience and Nanotechnology (ICN2)
2. Catalonia Institute for Energy Research (IREC)
- Keywords
nanoparticles, SBA-15 nanostructures, HRTEM, STEM-EELS, heterogeneous catalysis
- Abstract text
The rise of CO2 concentration in the atmosphere is considered the main challenge to mitigating global warming1. Therefore, there is an urgent need to further stimulate the society in the energy scenario transition from fuel-based to renewable carbon resources, and therefore to realise a closed-cycle carbon process: CO2 methanation through Sabatier reaction represents one of the proposed solutions.
It is important to develop advanced catalysts, with low-temperature and stable activity. Here we propose the fabrication of Ni-CeO2 catalyst by wet impregnation of mesoporous silica SBA-15 templates with cerium nitrate and nickel nitrate aqueous solutions2, 3. The obtained sample was tested in methanation of CO2 (Sabatier reaction), proving to be highly stable, efficient and selective towards CH4.
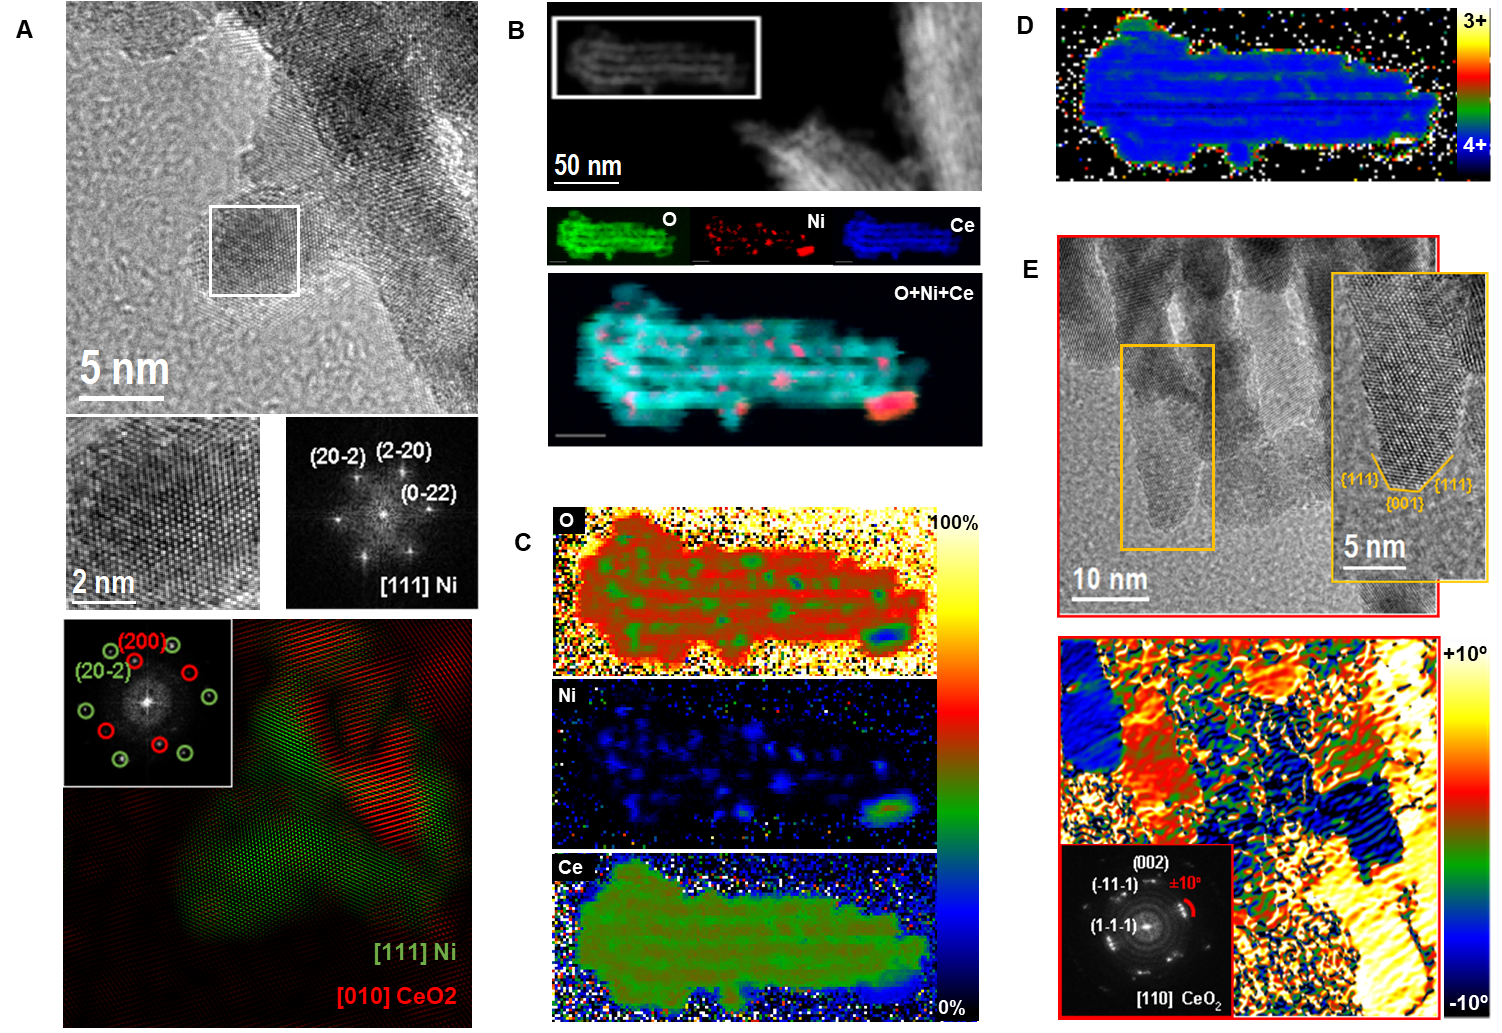
In order to address the exceptional performances observed, we performed a detailed transmission electron microscopy study in order to precisely understand their composition, the arrangement of the different chemical species and valence state variation along the nanostructure. In Figure 1 A we investigated in detail the structure of the Ni nanoparticles (NPs). As it is possible to observe in the indexed power spectrum, the Ni structure is cubic with its [1 1 1] direction parallel with respect to the electron beam. Furthermore, the (20-2) Ni plane in the [1 1 1] zone axis is almost 18º rotated with respect to the (200) ceria plane in the [0 1 0] zone axis. In Figure 1 B the core-loss EELS chemical composition maps obtained from the Ni-CeO2 structure are reported. From the relative composition analysis, reported in Figure 1 C, it is evident that the Ni present is mostly metallic (as from the comparison of the O .% and Ni .% relative maps). Furthermore, Ni nanoparticles size distribution appears to have a bimodal behaviour showing two nanoparticles size regime: (i) below 10 nm and (ii) above 20 nm. We propose that the small nanoparticles can be located both on the surface and inside the ceria mesoporous structure, while the big nanoparticles are located only on the surface of the ceria as they cannot penetrate it due to their big size. Analysing Ce M5 and M4 relative ratio, it is possible to evaluate the cerium oxidation state distribution within the sample as it is reported in Figure 1 D, observing that the ceria crystallites contain mostly Ce4+ ions. A closer look on the ceria structures is given in Figure 1 E, showing cubic fluorite CeO2 structure imaged along its [1 1 0] zone axis. Notice that most of the SBA channels follow the same orientation with slight axial tilts of ±10º. The area evidenced in the yellow box grow along the same axis as the previous structure, and here it is possible to highlight the termination of these nanostructures showing that those expose mainly {1 1 1} and {0 0 1} family of planes. In order to highlight the common axis/orientation of the different SBA-15 channels and to quantify the corresponding crystal rotation we performed geometrical phase analysis (GPA) taking as reference the frequency corresponding to the (-1 1 1) direction, as reported in Figure 1 E (bottom). Additionally, electron tomography experiments are planned to reconstruct the 3D structure of Ni-CeO2 and to investigate Ni nanoparticles distribution within the mesoporous structure.
Figure 1 (A) HRTEM image of Ni nanoparticle on the ceria mesoporous structure together with the blow up in the Ni nanoparticle area and its corresponding indexed power spectrum. In the bottom a frequency filtered map evidencing Ni and CeO2 planes is also reported. (B) HAADF STEM image of the sample and STEM-EELS elemental maps obtained on the selected areas as indicated in the white box. The maps shown in the Spectrum Images have been obtained by using: O k-edge at 532 eV (green), Ni L-edge at 855 eV (red) and Ce M-edge at 883 eV (blue), as well as composites of O-Ni-Ce. Scale bar in the maps equal to 20 nm. (C) Relative intensity maps of the different elements. (D) Ce M5/M4 intensity ratio map is also reported. (E) HRTEM image of the Ni-ceria structure. In the yellow panel the blow-up of the ceria SBA-15 edge is highlighted evidencing the exposed planes. The power spectrum of the full image (red box) and GPA rotation map are also reported.
- References
- Raphael Neukom et al. Nature 2019, 571, 550.
- Andreina Alarcón et al. Applied Catalysis B: Environmental 2020, 263, 118346.
- Jordi Arbiol et al. Applied Physics Letters 2002, 81 (18), 3449.