Comparison of segmentation algorithms for FIB/SEM tomography of porous polymers: Importance of image contrast for machine learning segmentation
- Abstract number
- 228
- Event
- Virtual Early Career European Microscopy Congress 2020
- Presentation Form
- Submitted Oral
- DOI
- 10.22443/rms.emc2020.228
- Corresponding Email
- [email protected]
- Session
- DHA.2 - Advances in 3-dimensional image reconstruction
- Authors
- Martin Čalkovský (1, 2), Dr. Erich Müller (2), Dr. Matthias Meffert (2), Nadejda Firman (2), Frederik Mayer (1, 3), Prof. Martin Wegener (1, 3), Prof. Dagmar Gerthsen (1, 2)
- Affiliations
-
1. 3DMM2O - Cluster of Excellence (EXC-2082/1–390761711), Karlsruhe Institute of Technology (KIT)
2. Laboratory for Electron Microscopy, Karlsruhe Institute of Technology (KIT)
3. Institute of Applied Physics, Karlsruhe Institute of Technology (KIT)
- Keywords
FIB/SEM tomography, 3D image reconstruction, porous polyemrs, Monte Carlo simulations, machine learning segmentation
- Abstract text
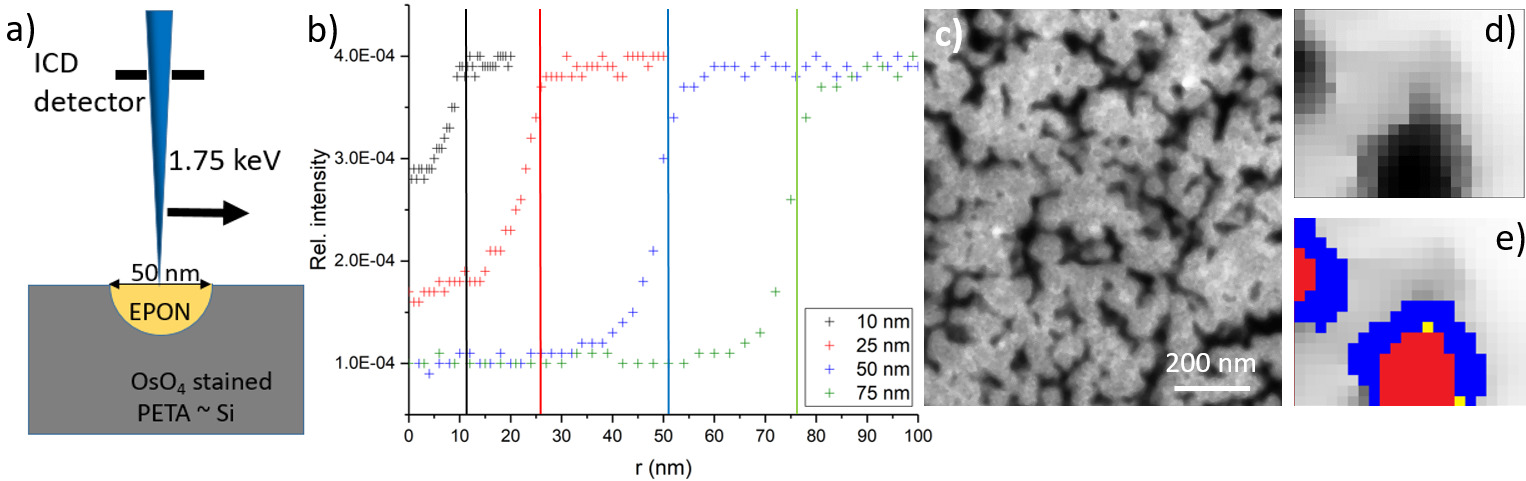
Throughout the last decade combined focused-ion-beam milling/scanning electron microscopy (FIB/SEM) tomography [1] has become an important technique for three-dimensional (3D) quantitative analysis of porous materials. In this technique, FIB milling and SEM imaging is alternately performed to obtain a stack of images that can be used to reconstruct the 3D structure. The biggest advantage is the ability to investigate rather large sample volumes up to several 100 μm3 at high resolution in the 1 nm range. The most crucial step in 3D quantitative analysis is SEM image segmentation of regions belonging to the pore and material phases. Several approaches have been developed based on global [2] or local [3] thresholding methods. More recently segmentation techniques based on machine learning (ML) algorithms have emerged, which proved to be more noise tolerant and reach lower misclassification rates than traditional segmentation algorithms [4]. However, an input from the user and correct interpretation of the SEM images are necessary prerequisites for the ML training procedure. Segmentation problems are illustrated by Fig.1 c), which shows an image from a tomography image series obtained from an Os-stained porous PETA (C14H18O7) polymer with the pore phase showing dark contrast. Plotting the histogram of such an image yields only one broad peak for the PETA phase with a shoulder at lower grey values representing pores. Using histogram-based segmentation, substantial errors have to be expected. To correctly determine the grayscale intensity at PETA/pore interfaces, it is essential to achieve an understanding of image contrast formation.
In this work we focus on optimizing the segmentation procedure of FIB/SEM tomography data of porous PETA polymer structures. By applying Monte Carlo (MC) simulations with the NISTMonte program package [5], SEM contrast formation is investigated and criteria for selecting the intensity at the pore/polymer interface are derived. With this knowledge a ML algorithm was trained to automate the segmentation procedure. Comparison of this new approach with traditional global thresholding algorithms show clear supremacy of ML algorithms in the segmentation procedure.
Porous PETA polymer structures were stained with OsO4 to increase the image intensity of the PETA phase. The porous structure was then gently infiltrated with self-prepared EPON resin to stabilize the inner sample structure. FIB/SEM tomography was performed in a dual-beam Helios G4-FX. SEM images were acquired with the In-Column Detector (ICD) detector at 1.75 keV primary electron energy. The Avizo software (FEI) and Matlab 2017b were used for data analysis. The trainable WEKA segmentation algorithm [6] implemented into ImageJ [7] was used for segmentation.
Fig.1 a) shows a model of an EPON infiltrated half-pore in a stained PETA structure used for MC-simulations. Intensity line profiles are simulated by performing MC simulations along the direction of the black arrow. The intensity is obtained by summing up the backscattered electrons in the scattering angle range of the ICD detector. In Fig.1 b) intensity line profiles are shown for different half-sphere radii with corresponding color-coded vertical lines indicating the radius of the half-sphere pores. The line profiles reveal that the PETA/pore interface at the sample surface corresponds to the region in the SEM image where the intensity of the PETA phase starts to drop towards the intensity of the infiltrated pore. This knowledge is essential for correct image segmentation. In Fig. 1c) one image of the FIB/SEM image stack is shown, which has to be segmented. An enlarged section of Fig. 1c) is shown in Fig. 1d) revealing the difficulty of image segmentation due to nonzero penetration depth of the primary electrons leading to out-of-plain imaging information, which is represented by the gradual intensity transition between PETA (bright) and pore (dark). The pore size resulting from segmentation with the conventional Otsu [8] and fuzzy c-means [9] thresholding algorithms is indicated by the red and red/yellow regions in Fig. 1e). The WEKA segmentation algorithm was trained according to the knowledge obtained from MC simulations (Fig. 1b)) and applied to Fig. 1d). The resulting pore sizes are considerably enlarged as indicated by the blue region in Fig. 1e) in agreement with results obtained from MC simulations.
Our results demonstrate that both conventional segmentation methods underestimate the pore size and thus lead to incorrect image segmentation. In contrast, ML segmentation yields more accurate results and thus enable trustworthy quantitative analysis of porous materials.
Fig. 1. a) A model of EPON infiltrated half-pore in stained PETA used for MC-simulations. b) Simulated intensity line profiles across the PETA/pore interface for the scattering angle range of the ICD detector with MC simulations performed along the arrow in a). Different colors correspond to different half-pore radii, indicated by vertical lines. c) Example of a 1.75 keV BSE-SEM image from FIB/SEM tomography of the OsO4-stained and EPON-infiltrated porous PETA structure. d) Enlarged section of the SEM image in c) with 1.6 nm pixel size. e) Pore segmentation of d) using the conventional Otsu (red) and fuzzy c-means (red/yellow) global thresholding. The blue region represents the segmentation after application of the WEKA ML algorithm, which according to b) most accurately segments pores.
- References
[1] L Holzer et al, J. Microsc. 216 (2004), p. 84-95.
[2] D Kim et al, Microsc. Microanal. 25 (2019), p. 1139-1154.
[3] M Salzer et al, Mater. Charact. 95 (2014), p. 36-43.
[4] M Andrew, Comput. Geosci 22 (2018), p. 1503-1512.
[5] N W M Ritchie, Surf. Interface Anal. 37 (2005), p. 1006-1011.
[6] I Arganda-Carreras et al, Bioinformatics 33 (2017), p. 2424-2426.[7] J Schindelin, Nat. Methods. 9 (2012), p. 676-682.
[8] N Otsu, IEEE Transactions on Systems, Man. and Cybernetics. 9 (1978), p. 62-66.
[9] J C Bezdek, R Ehrlich and W Full, Comput. Geosci. 10 (1984), p. 191-203 .[10] We acknowledge funding by the Deutsche Forschungsgemeinschaft (DFG, German Research Foundation) under Germany’s Excellence Strategy–2082/1–390761711.