Decoding mineral zoning from BSE images using Machine Learning
- Abstract number
- 341
- Event
- European Microscopy Congress 2020
- DOI
- 10.22443/rms.emc2020.341
- Corresponding Email
- [email protected]
- Session
- DHA.1 - Deep learning for analysis and interpretation of microscopy imaging data
- Authors
- Renat Almeev (2), Artem Leichter (1), Dennis Wittich (3), Philipp Beckmann (2), Torben Peters (1), Monika Sester (1), Francois Holtz (2), Franz Rottensteiner (3), Mona Weyrach (2)
- Affiliations
-
1. Leibniz University Hannover, Institut für Kartographie und Geoinformatik
2. Leibniz University Hannover, Institut für Mineralogie
3. Leibniz University Hannover, Institut für Photogrammetrie und GeoInformation
- Keywords
Back Scattered Electron image, Diffusion Modelling, Energy Dispersive X-ray Analysis, Electron Microprobe, Fully Convolutional Neural Network, Machine Learning, Olivine
- Abstract text
Compositional zoning in rock-forming minerals is used to decode the conditions at which these minerals are formed and stored in magma chambers (depth, temperature) as well as to shed light on the time scales of crystallization, magma recharge, resorption and etc. (diffusion chronometry [1]). For example, diffusion profiles of olivine crystals were used to demonstrate [2] how crystals can record the intrusion of magma which triggered the 1925–28 eruption of the Nea Kameni Volcano (Santorini, Greece). Such recharge-to-eruption activity at the volcanoes documented in products of previous eruptions provides characteristic time scales which together with seismic observations can potentially lead to improve hazard forecasts [2].
Volcanic rocks usually contain minerals with several types of zoning which requires time-consuming statistical work for identification and characterization of mineral populations and analyses of several thousands of crystals [3]. The most precise 1D compositional profile can be obtained using the electron microprobe analysis (with analytical acquisition for one crystal varying from hours to 1 day, depending on crystal size and element concentration). The energy dispersive X-ray (EDX) analysis can provide 2D elemental maps (with analytical acquisition for one crystal easily extending to several days to obtain high precision). However, 2D EDX map remains still less precise than a1D microprobe profile. A typical thin section size EDX elemental map of the volcanic rock (size ~27x46 mm) requires a week or more to recover compositional profiles with reliable quality. Alternatively, chemical zonings can be rapidly detected by Back Scattered Electron (BSE) images, but BSE images do not provide direct quantitative information on mineral compositions and require time-consuming calibrations using electron microprobe or EDX analyses to convert BSE into a compositional proxy (e.g. magnesian number of olivine, mg#=Mg/(Mg + Fe)). Considering the complexity of natural systems, a fast and reliable analysis of 2D BSE images requires the application of machine learning (ML) methods. The idea of the approach presented in this paper is to learn the relationship between BSE and magnesium number with a Deep Learning approach and then to predict the mg# composites from BSE images automatically.
Following the state of the art of machine learning in image analysis, we use an adopted U-Net [4] model, a Fully Convolutional Neural Network (FCN). FCN models are suited for this task, since they take rasterized maps (images) as input and produce rasterized maps as output. The classical application of U-Net is semantic segmentation, but it also has been successfully adopted to perform regression [5]. In our approach we train the network to perform the pixelwise mapping from the BSE image to the composition of EDX maps. FCNs have the advantage that they derive semantic information based on both structure and texture of the input data. This is important, because the mapping from the input intensities to the chemical composition is not unique, but depends on the type of the crystal. Structural information like the outline of single crystals can be learned by the model in order to solve the prediction of chemical compositions.
In this study we demonstrate how our model is used to recover chemical profiles in olivines from the Klyuchevskoy volcano (Kamchatka). High quality BSE and EDX maps of selected areas within one thin section, containing olivine phenocrysts, were acquired using a JEOL JSM-7610FPlus electron microscope (equipped with two Bruker XFlash 6|60 SDDs) and applying 15 kV acceleration voltage, 10 nA probe current, 10 cycles, 16 µs dwell time, line average of 15 and with resolution of 512 pixels (acquisition time ~ 150hours).
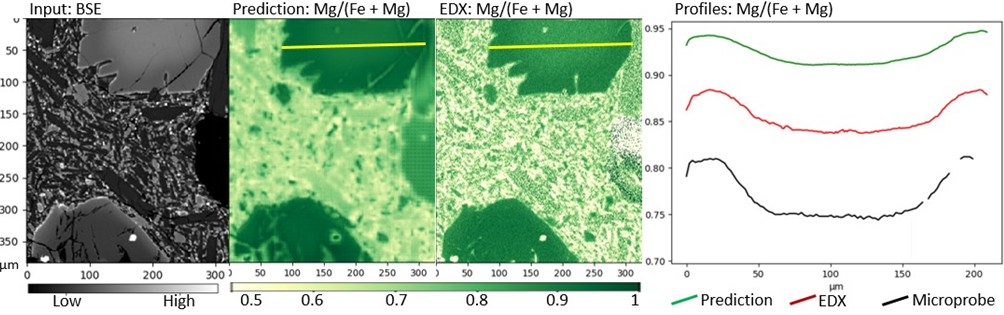
We trained our model to perform the pixelwise regression to predict mg# composition of EDX element maps from a BSE image. The olivine segmentation was conducted employing handcrafted thresholds applied to EDX maps. As an alternative approach, EDX maps were also used to envisage how the model is able to predict composition from a BSE image as input data. Figure 1 demonstrates how our network predicts a compositional profile in olivine for an area not used in training. The prediction is very similar to the ground truth (matrix areas should be ignored). The zonation of the olivine is the same in both cases despite of the shifted values. The shift between the predicted profile and the EDX profile can be clearly seen. Our preliminary results show that a properly trained FCN is capable of predicting chemical information based on the shape of the olivine and the density/textures information recorded in the BSE signal. The small difference between prediction and the ground truth is probably caused by the variations in input BSE values obtained on two subsets with time interval of several months. This will be addressed in future work.
Figure 1. Representative example of the prediction of Mg/Mg+Fe in olivine. The left image shows a BSE image used as input for the prototype model. The resulting prediction is shown in the second image from left (Prediction); it was trained based on the BSE input and EDX ground truth. The diagram on the right shows the compositional profiles by prediction, EDX and microprobe. The predicted profile (green) is shifted and scaled compared to the EDX (red) and Microprobe data (black, analyses in a 2 µm interval). Overall, the model predicts the shape of the profile well.
- References
[1] Chakraborty, Annual Review of Earth and Planetary Sciences (2008) 36, pp. 153-190.
[2] Martin et al., Science (2008) 321, 1178-1178.
[3] Kahl et al. (2015) Journal of Petrology 56, 2025-2067.
[4] Ronneberger et al. U-net: Convolutional networks for biomedical image segmentation. International Conference on Medical image computing and computer-assisted intervention. (2015) Springer, Cham.
[5] Yao, Wei, et al. Neurocomputing (2018) 312 364-371.