Decomposition of STEM spectrum-images into a linear combination of meaningful endmembers
- Abstract number
- 840
- Event
- European Microscopy Congress 2020
- DOI
- 10.22443/rms.emc2020.840
- Session
- PST.4 - Spectroscopies in Electron, X-ray and Ion Microscopy
- Authors
- Dr. Pavel Potapov (1), Dr. Axel Lubk (1)
- Affiliations
-
1. Leibniz Institute for Solid State Physics and Materials Research Dresden
- Keywords
EELS, EDX, hyperspectral data, MSA, PCA, spectrum-imaging
- Abstract text
Modern STEM instruments now deliver routinely EELS and EDX spectrum-images of huge size. This opens the possibility to apply the methods of Multivariate Statistical Analysis (MSA) to improve the quality and interpretability of results. In particular, Principal Component Analysis (PCA) was routinely applied for denoising data [1]. However, PCA delivers results in the abstract form precluding its interpretation. This issue can be addressed by another family of the MSA methods – unmixing algorithms.
Unlike PCA, an unmixing approach decomposes the data on a linear combination of endmembers – the spectra with clear physical meaning, corresponding for instance to the real compounds constituting the object. One example of such approach is the Bayesian unmixing method by Dobigeon [2], which however involves the extensive Monte-Carlo simulations that probably limited its wide application in the STEM area.
In this work, we develop a simple unmixing algorithm based on the Vortex Component Analysis (VCA) [3]. The original VCA strategy is not well suited for STEM spectrum-imaging and must be significantly modified. First, the treatment should consider noise always present in STEM data. Second, the VCA results often appear non-unique while the reproducibility is a key requirement for a robust algorithm. We elaborate this issue by the statistical application of the VCA routine followed by clustering the resulted endmembers. The different clustering strategies are discussed.
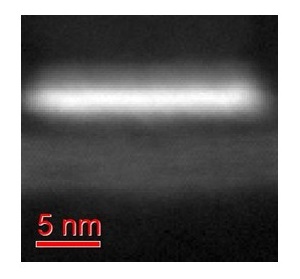
The algorithm was tested on several synthetic and real-life data sets. Fig. 1-3 show the results for an EELS spectrum-image of a nanoscaled semiconductor device composed of a number of various compounds. PCA reduces the spectrum dimensionality of the data from 2048 to 6 while the forthcoming unmixing algorithm deduces 5 meaningful endmembers in this 6-dimensional factor space. The spectra and distribution maps for the obtained endmembers fit well the expected structure of the device.
Figure 1. HAADF image of a semiconductor device subjected by STEM EELS spectrum-imaging.
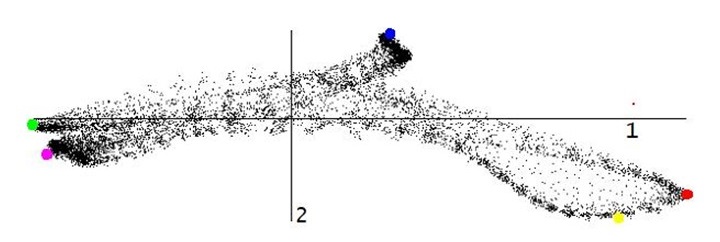
Figure 2. The visualization of data variations in the spectrum-image obtained from the area in Fig.1. The variations appear in the 6-dimensional factor space produced by PCA. An only one 2D-slice (along the 1st and 2nd principal components) of the 6-dimensional simplex is shown. The colored markers indicate the positions of endmembers deduced by our unmixing algorithm.
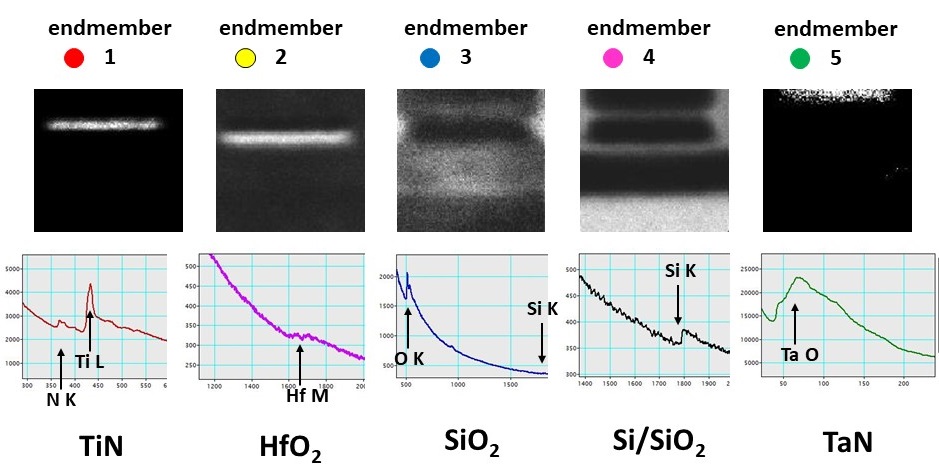
Figure 3. The spectra and the contribution maps of the endmembers shown in Fig.2. The endmembers correspond to the actual phases (TiN, TaN, Hf oxide, Si oxide and oxidized Si) constituting the device.
- References
[1] see for example: M Watanabe et al, Micr. Anal. (2009) p.6.
[2] N Dobigeon et al, IEEE Trans. 57 (2009) p.4355.
[3] JMP Nascimento, JMB Dias, IEEE trans. Geoscince Remote Sensing 43 (2005) p.898.
[4] The authors appreciate support from ERC (grant 715620 under the Horizon 2020 program) and DFG project 431448015.