Identification of microplastic particles by pair distribution function analysis of electron diffraction data
- Abstract number
- 494
- Event
- European Microscopy Congress 2020
- DOI
- 10.22443/rms.emc2020.494
- Corresponding Email
- [email protected]
- Session
- PST.5 - Diffraction techniques and structural analysis
- Authors
- Dr. Christian Rohner (1), Prof. Robert Schlögl (1, 2), Dr. Thomas Lunkenbein (1)
- Affiliations
-
1. Fritz Haber Institute of the MPS
2. MPI for Chemical Energy Conversion
- Keywords
electron diffraction, microplastic, pair distribution function, polymers, TEM
- Abstract text
1. Summary
We present a pair distribution function (PDF) analysis of electron diffraction data applied to micron sized polymer particles. The study explores the PDF technique as a means for the chemical identification of microplastic particles in the TEM.
2. Introduction
Microplastic pollution is considered an increasing problem for the environment. At the moment, no analytical technique allows the quantification of synthetic organic polymer particles with sizes < 10 µm in samples taken from the water compartment [1]. In that regard, we envision PDF analysis to become a valuable tool in combination with mass, IR and Raman spectroscopy, as the PDF is sensitive to the average local chemical environment and can be derived from electron diffraction data collected with a spatial resolution on the nanoscale.
Carbon based polymers are among the most beam-sensitive materials and the samples quickly degrade under the electron beam. This damaging beam effect is carefully taken into account and information about the materials in question is gained by its analysis. Further, this analysis may give information on the structural changes under aging conditions in the environment. The degradation mechanisms of the observed radiolysis induced by the electron beam are similar to the radiolysis by UV light.
3. Materials and methods
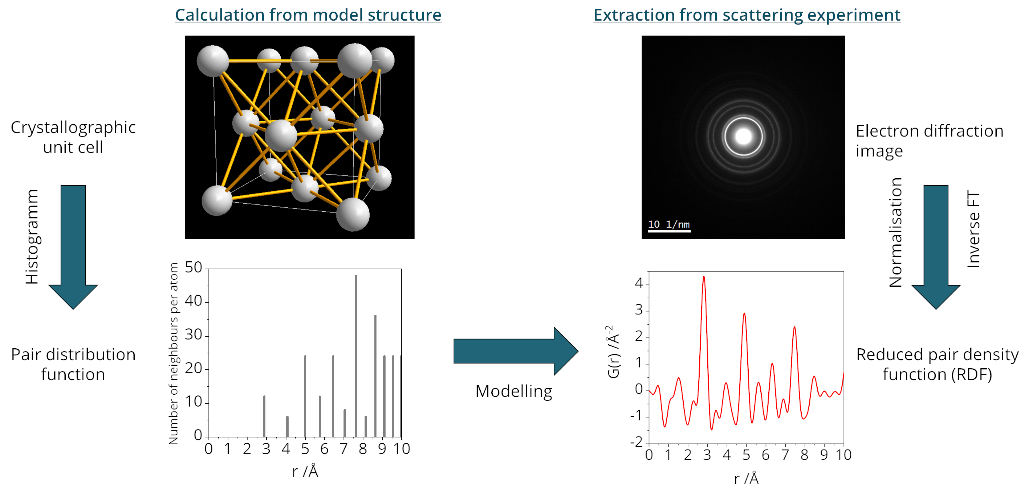
Pair distribution functions can be understood as histograms of the distances between atoms in a material. They can be extracted by inverse Fourier transformation of properly corrected and normalized total electron scattering intensity [2, 3]. The reduced pair density function (RDF, G(r)) is the direct result of this treatment of the data. It shows the short and medium range order of amorphous and semicrystalline materials which cannot necessarily be deduced from standard analysis of Bragg reflections. A value of zero in the RDF represents the average density of a material, while positive and negative values represent a higher or lower density, respectively, at a given distance r measured from a random atom (Figure 1).
Figure 1. Schematic of the determination of the reduced pair density function from a model structure and from experimental data.
By adjusting the measurement conditions, the particles can be located under minimal beam exposure. The diffraction patterns are recorded immediately at the initial exposure to the more intense parallel beam that is necessary for the acquisition of high quality diffraction data. Moreover, time series of the diffraction are recorded and the structural changes of the material under the beam influence are analyzed.
The samples were produced by cryo ball-milling of e.g. polyethylene (PE), polyethylene terephthalate (PET), and polyamide films (PA). The resulting powders were prepared for the TEM measurements by drop casting of isopropanol suspensions onto TEM grids. The samples were measured on a JEOL ARM200F equipped with a Gatan Orius and a Gatan OneView camera at 80 kV and 200 kV. Movies of the diffraction were recorded with framerates of 2 - 3.33 fps. EDS spectra were aquired after the diffraction measurements.
4. Results and discussion
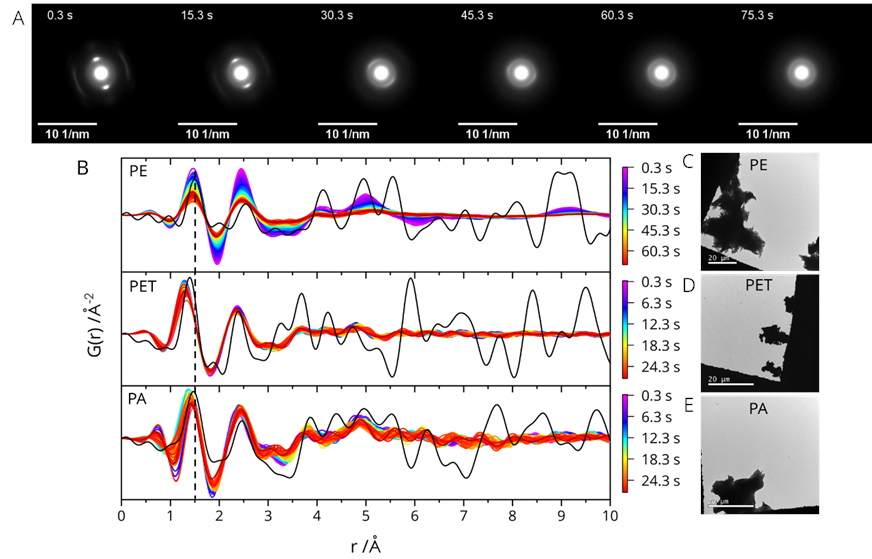
The change in the crystalline structure of PE under the electron beam is imaged in the series of diffraction patterns (selected frames shown in Figure 2A). The disappearence of the bright spots and appearance of a ring pattern indicates an amorphisation of the material. This change is also visible in the RDFs calculated for each diffraction pattern (Figure 2B, top row). The intensity of peaks in the graph decreases with the duration of the beam exposure which indicates a decreasing order in the structure. Comparison of the experimentally determined RDFs with model RDFs (black lines in Figure 2B)) shows a good fit for short and intermediate pair distances in the case of PE.
Equivalent diffraction measurements were conducted on PET and PA particles. For PET and PA, only the first two peaks in the RDFs show considerable intensity. This can be attributed to a low crystallinity of the materials prior to the beam exposure. The faint peaks in the range of r = 3.5 - 5.5 Å can be assigned to intrachain pairs. The absence of peaks for r > 6 Å indicates a lack of long range order beyond one monomeric unit. The position of the first peak is shifted to smaller distance for PET and PA compared to PE (compare the dashed line) due to the presence of shorter bonds of carbon with the hetero atoms (PA, PET) and C-C double bonds (PET). The shift is small but highly reproducible.
EDS measurements qualitatively confirm the elemental compositions of PA and PET where nitrogen was detected in the spectra of PA and absent in the case of PET. Comparing PE and PET/PA, a much stronger beam influence is observed for PE. TEM images of the corresponding microplastic particles are shown in Figure 2C-E. The particle sizes are on the order of 5-50 µm.
Figure 2. A) Selected frames of the time series of diffraction patterns measured on a PE microplastic particle (images cropped). B) Plots of RDFs calculated from the individual frames of a diffraction series measured on PE, PET, and PA, respectively. The time of acquisition of an underlying frame is indicated by the colour scale bar. Model RDFs are shown as black lines. C-E) TEM images of PE, PET, and PA particles (the scale bars are 20 µm).
5. Conclusion
The measurement of diffraction movies in combination with PDF analysis can be applied for the distinction of carbon-based polymer reference materials. Perspectively, the smallest size fraction of microplastic particles can be identified in samples taken from the environment.
- References
[1] T Kögel et al, Sci. Total Environ. 709 (2020), p. 136050.
[2] X Mu et al, J Appl. Cryst. 46 (2013), 1105.
[3] M Abeykoon et al, Z. Kristallogr. 227 (2012), p. 248.
[4] The authors thank Ulrike Braun and Korinna Altmann (Bundesanstalt für Materialforschung und –prüfung, Berlin, Germany) for the provision of the samples and Xiaoke Mu and Christian Kübel (Karlsruhe Institute of Technology, Germany) for providing the MATLAB code for the calculation of the RDFs. The research was funded by the German Federal Ministry of Education and Research (RUSEKU project).