Improving depth resolution of phase images by ptychography
- Abstract number
- 542
- Event
- European Microscopy Congress 2020
- DOI
- 10.22443/rms.emc2020.542
- Corresponding Email
- [email protected]
- Session
- PST.3 - New Instrumentation
- Authors
- Dr. Ryusuke Sagawa (1), Mr. Hiroki Hashiguchi (1), Dr. Robert Ritz (2), Dr. Martin Huth (2), Dr. Heike Soltau (2), Mr. Yukihito Kondo (1)
- Affiliations
-
1. JEOL Ltd.
2. PNDetector GmbH
- Keywords
ptychography
pixelated STEM detector
depth resolution
optical depth sectioning
- Abstract text
Thanks to the development of aberration correctors in electron microscopy, lateral resolution (X-Y directions) has been improved down to ~40 pm in scanning transmission electron microscopy (STEM) [1]. The resolution in depth (Z) direction, on the other hand, has recently gained much interests as it is important to reconstruct a whole 3-dimensional (3D) structure of sample [2]. It is effective to use a beam with larger convergence angle to enhance Z resolution (dz), since dz has a relation with the convergence angle (α) and wavelength of the electrons (λ), as dz = λ/sin2(α). With further correction of higher order aberrations, the effective convergence angle has become as high as up to 70 mrad in semi-angle, resulting in a few nm of Z resolution at 300 kV in High Angle Annular Dark-Field (HAADF)-STEM images. The pixelated STEM detectors which has been recently developed and commercialized can use the full the information on the detector plane. They evolve rapidly in their performance, and they now have fast frame rate of several thousand frames per second and several ten thousand pixels per frame [3,4]. Using the 4-dimensional (4D) dataset obtained by the detectors, one can reconstruct a phase image by an image processing method called ptychography [5,6]. By the phase manipulation in the process, the images of phase contrast with high signal-to-noise (S/N) ratio are obtained. Furthermore, the residual aberrations present in the images can be removed or changed by adding aberration correction functions during the reconstruction process. This also enables the creation of though-focus images, which in turn, serve as the optical depth sectioning technique for reconstructing the 3-dimensional structure of specimen [7]. In this paper, we aim to prove the ability to control the Z resolution of the through-focus images by further manipulation of the phase signal on detector plane.
A pixelated STEM detector (4DCanvasTM, JEOL,) with a direct electron CCD image sensor (pnCCD, PNDetector), whose maximum readout speed is 7,500 fps was used in the experiment [3,4]. The operable accelerating voltage of the detector is confirmed to be 20 ~ 300 kV. The detector was integrated into an aberration corrected 200 kV electron microscope (NEOARM, JEOL). As this detector is installed below the conventional ADF detector, we can simultaneously record a 4D dataset by the pixelated detector and a HAADF-STEM image by the ADF detector. In our experiments, the data was taken with a frame rate of 7,500 fps (~133 μs in dwell time per pixel). The fast readout enabled recording of 256 x 256 pixels scan within 10 seconds.
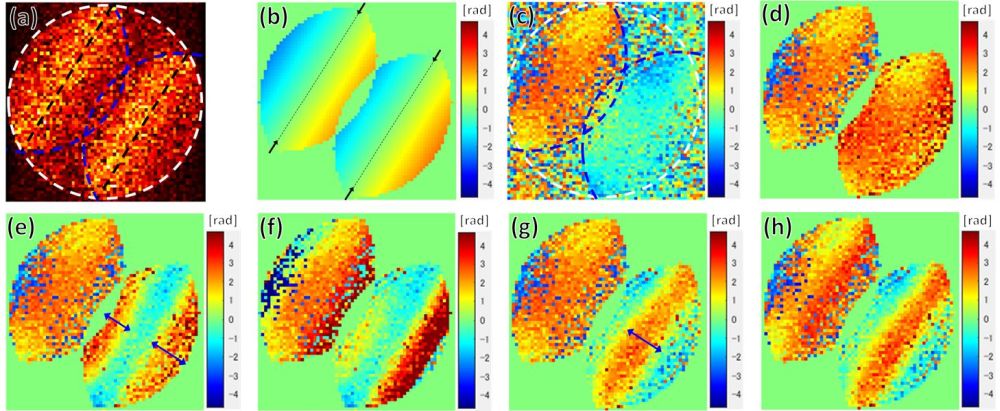
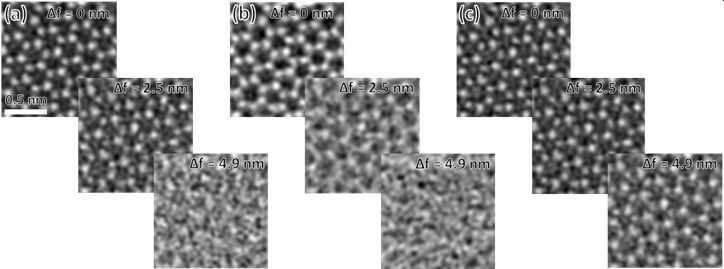
In the ptychography, phase manipulation is performed to the signals extracted from each spatial frequency. If we look at the interference signal between a transmitted beam and a diffracted beam of a certain spatial frequency, one will notice that the signal amplitude has its maxima at some areas (Fig. 1(a)). The areas are called achromatic lines, because the phase in the areas is not affected by the fluctuation of electron beam in Z direction due to distribution of wavelengths of electrons and/or the fluctuation of current of an objective lens. This effect can be understood if we map the phase shift due to defocus. The phase shift is almost zero only in the areas near the achromatic lines, since the path length of both beams are the same on the line, as shown in Fig. 1(b). In normal ptychography operation to obtain phase image with enhanced image contrast, we simply add π to one of the two interference areas to make them in phase, as shown in Figs. 1(c) and 1(d). However, in the suggested reconstruction, we added π only to the other area than the achromatic condition to make the phase image contrast sensitive to defocus as shown in Figs. 1(e) and (f), resulting in enhancement of Z resolution. We call this process ‘process A’. Inversely, when π is added only to the area of achromatic areas as shown in Figs. 1(g) and 1(h), the image contrast is expected to be insensitive to defocus, resulting in longer focal depth. We call this process ‘process B’. Figure 2 shows reconstructed through-focus phase images of mono-layer graphene at 80 kV by ptychography. Fig. 2(a) shows images after normal ptychography process, Figs. 2(b) and 2(c) show images after the process A and B, respectively. Compared to the image series (a), the series (b) start to blur more quickly, and the series (c) show the lattice contrast even at 4.9 nm of defocus.
While the technique to improve the depth resolution introduced here can directly be used for the optical depth sectioning, the technique to make focal depth longer without losing spatial resolution in x-y directions can be used for tilted sample in tomography, where the blur in image due to defocus is undesirable.
Figure 1. Ptychographic signal at a certain spatial frequency of mono-layer graphene. (a) Amplitude map. Achromatic lines are indicated as black dashed lines. (b) Phase shift due to defocus. The shift is almost zero near the dotted lines. (c) Original phase map. (d) Phase map after adding π to one of the interference areas. Amplitude other than the interference areas are set to zero in order to remove unnecessary signal for denoising. (e) Phase map after adding π only to the area where achromatic condition is not met (indicated by arrows). (f) Phase map after adding 3 nm of defocus to (e). (g) Phase map after adding π only to the achromatic areas (indicated by an arrow). (h) Phase map after adding 3 nm of defocus to (g).
Figure 2. Reconstructed through-focus phase images by (a) normal ptychography process, (b) higher Z resolution method and (c) lower Z resolution method. Condenser lens aperture of 40 mrad in semi-angle was used. The defocus value is indicated in each image. Compared with defocused images in (a), the images in (b) are more blurred and the lattice contrast is more preserved in the images in (c).
- References
[1] S Morishita et al, Microscopy, 67 (2018) p. 46.
[2] R Ishikawa et al, Ultramicroscopy, 151 (2015) p. 122.
[3] H Ryll et al, J. Instrum., 11 (2016) P04006.
[4] R Sagawa et al, Microsc. Microanal., 23 (2017) p. 52.
[5] PD Nellist et al, Nature, 374 (1995) p. 630.
[6] TJ Pennycook et al, Ultramicroscopy, 151 (2015) p. 160.
[7] H Yang et al, Nature Communications, 7 (2016) p. 12532.