In-line detection of residual lens aberrations influencing differential phase contrast STEM images
- Abstract number
- 1198
- Event
- European Microscopy Congress 2020
- DOI
- 10.22443/rms.emc2020.1198
- Corresponding Email
- [email protected]
- Session
- PST.1 - Phase Microscopy
- Authors
- Julius Bürger (1), Thomas Riedl (1), Jörg K. N. Lindner (1)
- Affiliations
-
1. Paderborn University
- Keywords
Differential Phase Contrast, Scanning Transmission Electron Microscopy, high-resolution, lens aberration, Cs correction, simulation.
- Abstract text
Summary
Differential phase contrast (DPC) imaging in scanning transmission electron microscopy (STEM) allows for the measurement of electromagnetic field distributions on the nm scale. In this contribution the sensitivity of DPC imaging to lens aberrations, specimen thickness and tilt is analysed by multislice image simulations of SrTiO3 [001] and Si [110]. By analysing the angular deflection distribution using scattergram plots, which show the numbers of pixels in the image as a function of deflection magnitude and direction, residual lens aberrations and specimen misalignment are revealed. Utilising the scattergram as an “in-line” tool, residual lens aberrations can be readily minimised.
Introduction
DPC imaging is an uprising STEM technique which maps the deflection of the direct beam arising from electric and magnetic fields in the specimen by using a beam position sensitive detector. In combination with state-of-the-art Cs correction electric fields and charge distributions can be measured with sub-atomic resolution. Even though today, the optimisation of illumination conditions with e.g. a hexapole Cs corrector minimises the lens aberrations up to the fifth geometrical order, residual lens aberrations have a considerable impact on the evaluation of measured electric fields and charge density distributions. High order lens aberrations are quite stable, while low order lens aberrations as e.g. defocus and two-fold astigmatism have to be corrected manually between subsequent scans. The present study investigates the influence of residual lens aberrations and specimen thickness and tilt by analysing the deflection distribution in multislice simulated images of SrTiO3 [001]. The deflection distribution is displayed as a scattergram showing the number of image pixels within small intervals of deflection magnitude and direction. In addition, by utilising the scattergram as an „in-line“-tool during microscope operation, residual lens aberrations can be detected and subsequently corrected. Results are confirmed by a good agreement of simulated with experimental DPC images of Si [110].
Methods and Materials
Atomically resolved DPC images of Si [110] are acquired with a probe-side Cs-corrected JEOL JEM ARM200F equipped with a rotatable eight-fold segmented annular detector for the determination of beam deflection. The deflection magnitude and direction are determined by measuring signal differences of a set of opposing detector segments. A self-written Matlab-based program for „in-line“-detection of residual lens aberrations displays the scattergram directly after image acquisition and compares the measured to a simulated deflection distribution of one unit cell. Multislice DPC image simulations of SrTiO3 [001] and Si [110] are obtained using Dr. Probe software [1]. Simulation parameters such as the azimuthal and polar detector angles and the beam semi-convergence angle are determined in a previous convergent beam electron diffraction experiment in order to match realistic microscope parameters. The influence of specimen thickness, defocus, two-fold as well as three-fold astigmatism, coma, third-order spherical aberration and specimen tilt is analysed by image simulations of SrTiO3 [001].
Results and Discussion
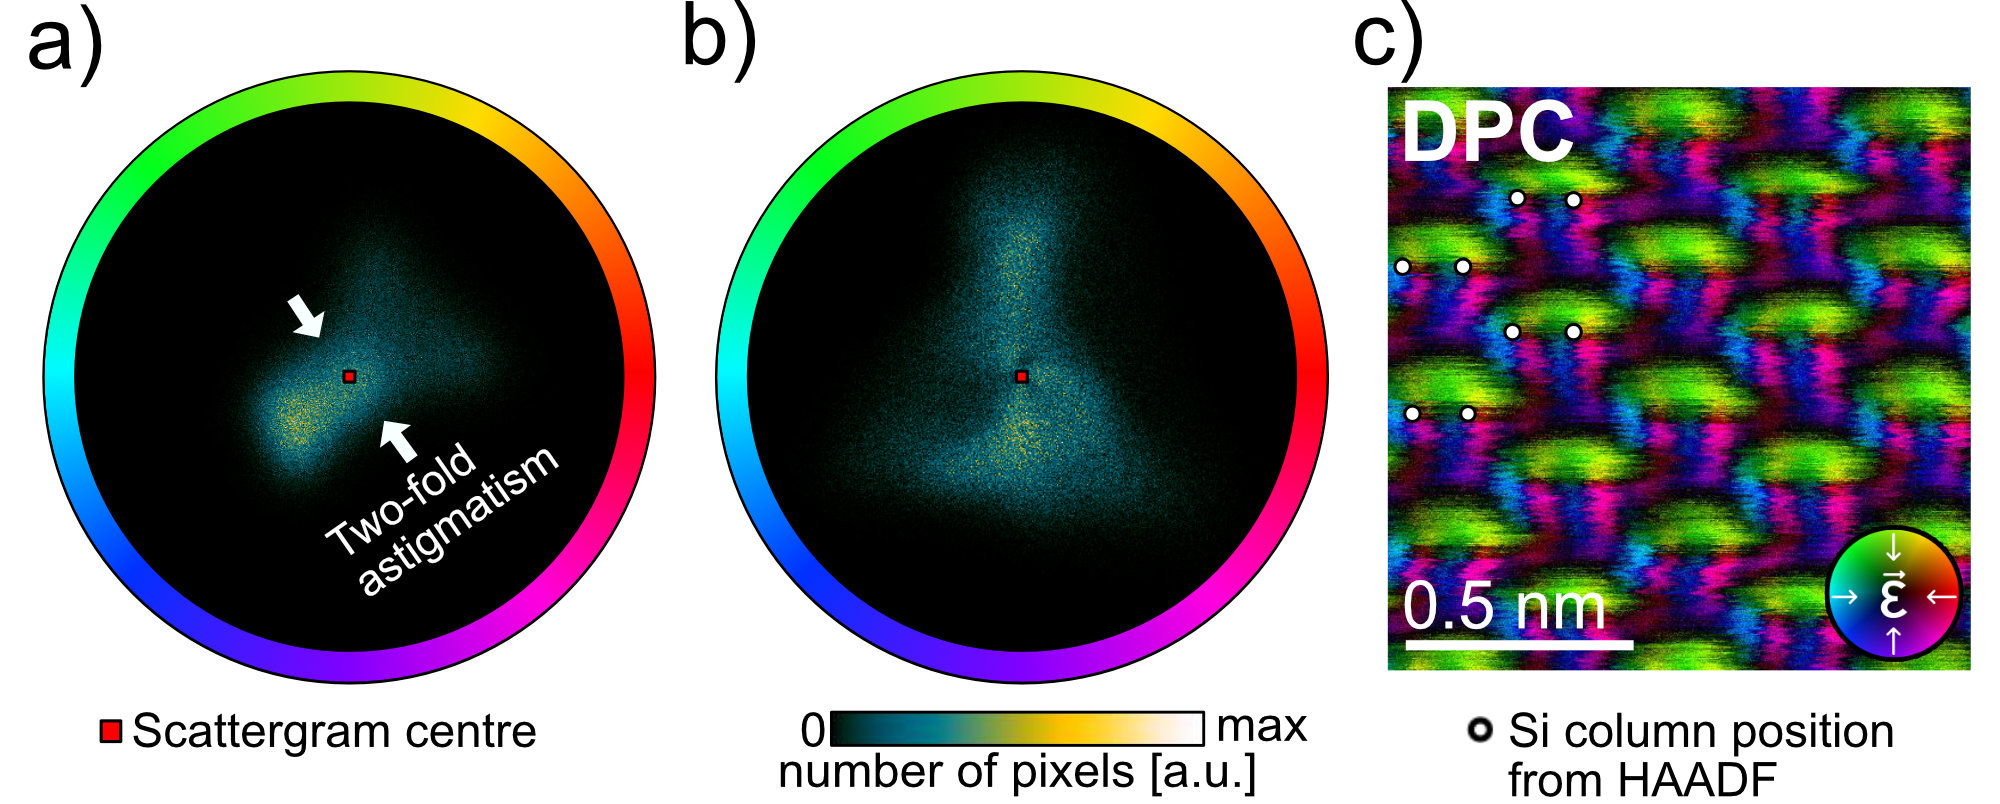
It is found that for thicknesses above 5 nm an increasing specimen thickness reduces the measurable deflection per specimen thickness resulting from scattering and diffraction. In addition, the presence of diffraction spots in the detection plane introduces line-like features in the DPC images. Furthermore, the diffraction contrasts lead to line-like features in the scattergram having the same symmetry as the diffraction pattern. Maximum DPC signal within the analysed ranges of specimen thickness and defocus is obtained for a focal plane slightly below the centre of the specimen. In contrast, maximum correlation of the deflection distribution to the one of one unit cell occurs for a focal plane slightly below the specimen. At specimen thicknesses close to 20 nm acceptable correlation of DPC images with the image of one unit cell and deflection magnitudes are achieved with the focus within the specimen close to the exit-surface. Similar to the effect of increasing specimen thickness a deviating defocus leads to line-like features arising from a diffraction pattern in the detection plane. Apart from the line-like features the overall measurable deflection magnitude is reduced leading to a compressed appearance of the deflection distribution in the scattergram. Two-fold astigmatism gives rise to elongated DPC image features in the direction of the astigmatism. The deflection distribution in the scattergram is then laterally compressed in astigmatism direction (Fig. 1 (a)). Higher order lens aberrations reshape the deflection space and a symmetry in the scattergram depending on the symmetry of the lens aberration is observed (Fig. 1 (b)). In the presence of specimen tilt the DPC scattergram shows an off-centre maximum. Thus, an “in-line” scattergram analysis readily enables microscopists to detect residual lens aberrations and specimen misalignment. The applicability of scattergram analysis is confirmed by DPC measurements on Si [110] (Fig. 1 (c)) yielding good agreement with simulated images.
Figure 1: (a) scattergram of a DPC image with strong two-fold astigmatism. The strong two-fold astigmatism results in a laterally compressed deflection distribution around the centre of the scattergram (marked by a red dot). After correction of two-fold astigmatism residual three-fold astigmatism is observed (b) (triangular shape of the deflection distribution). The scattergram in (b) corresponds to the DPC image of Si [110] in (c). Atomic column positions are derived from the simultaneously acquired HAADF image and marked by white dots.
Conclusions
DPC imaging is highly sensitive to lens aberrations, specimen thickness and tilt. Lens aberrations have a characteristic influence on the beam deflection distribution. Thus, an “in-line” analysis of the deflection distribution enables microscopist to minimise residual lens aberrations [2].
- References
[1] J Barthel, Ultramicroscopy 193 (2018): 1-11.
[2] The authors are grateful for financial support within the NRW-Forschungskolleg “Leicht-Effizient-Mobil”.