Machine Learning on STEM-EDS Analysis for Improved Phase Quantification
- Abstract number
- 1128
- Event
- European Microscopy Congress 2020
- DOI
- 10.22443/rms.emc2020.1128
- Corresponding Email
- [email protected]
- Session
- PST.4 - Spectroscopies in Electron, X-ray and Ion Microscopy
- Authors
- Ms. Hui Chen (1), Dr. Farhang Nabiei (2), Dr. James Badro (1, 3), Dr. Duncan TL Alexander (1), Dr. Prof. Cecile Hebert (1)
- Affiliations
-
1. École polytechnique fédérale de Lausanne
2. University of Cambridge
3. Institut de Physique du Globe
- Keywords
Energy-dispersive X-ray spectroscopy (EDS), Machine Learning, Phase Quantification
- Abstract text
Energy-dispersive X-ray spectroscopy (EDS) is now considered as a routine measurement tool in laboratories or research institutes with analytical electron microscopy equipment, given the advances in electron-optics, and the development of detectors. However, the precision and accuracy of its chemical quantification remain inferior to those of other composition analysis techniques, such as inductively coupled plasma mass spectrometry (ICP-MS) [1] and secondary-ion mass spectrometry (SIMS) [2]. Biased quantification for minor and trace elements in EDS can happen. Another problem we can meet is the high sensitivity of certain samples to electron beam illumination, which limits the spectral signal to noise ratio that can be obtained and limits the possibility of revealing a sample’s volumetric phase distribution using tomographic techniques. At the same time, machine learning has made its presence in various fields and is making an impact in an impressively positive way [3]. Here we look to address the challenge of quantifying overlapped phases doped with trace elements by analyzing 2D STEM-EDS spectrum imaging (SI) data aided by several machine learning algorithms.
The specimens investigated are beam sensitive mineral assemblages resembling the Earth’s deep mantle [4]. They were synthesized from a pyrolite glass doped with Nd, Sm, Hf, Lu, and U (0.3 wt.% for each) under high-temperature (2000–3500 K) and high-pressure conditions (46–88 GPa) in a diamond anvil cell. The mineral assemblages always contain two phases, ferropericlase (Fp, MgO with a minor amount of Fe) and bridgmanite (Brg, MgSiO3 with minor amounts of Fe, Al, Ca and trace amounts of rare earth elements (REEs)). Ca-rich perovskite (Ca-Pv, CaSiO3) only shows at higher pressure cases and is the major host for REEs. It is noted that Si is absent in Fp while Mg is absent in Ca-Pv.
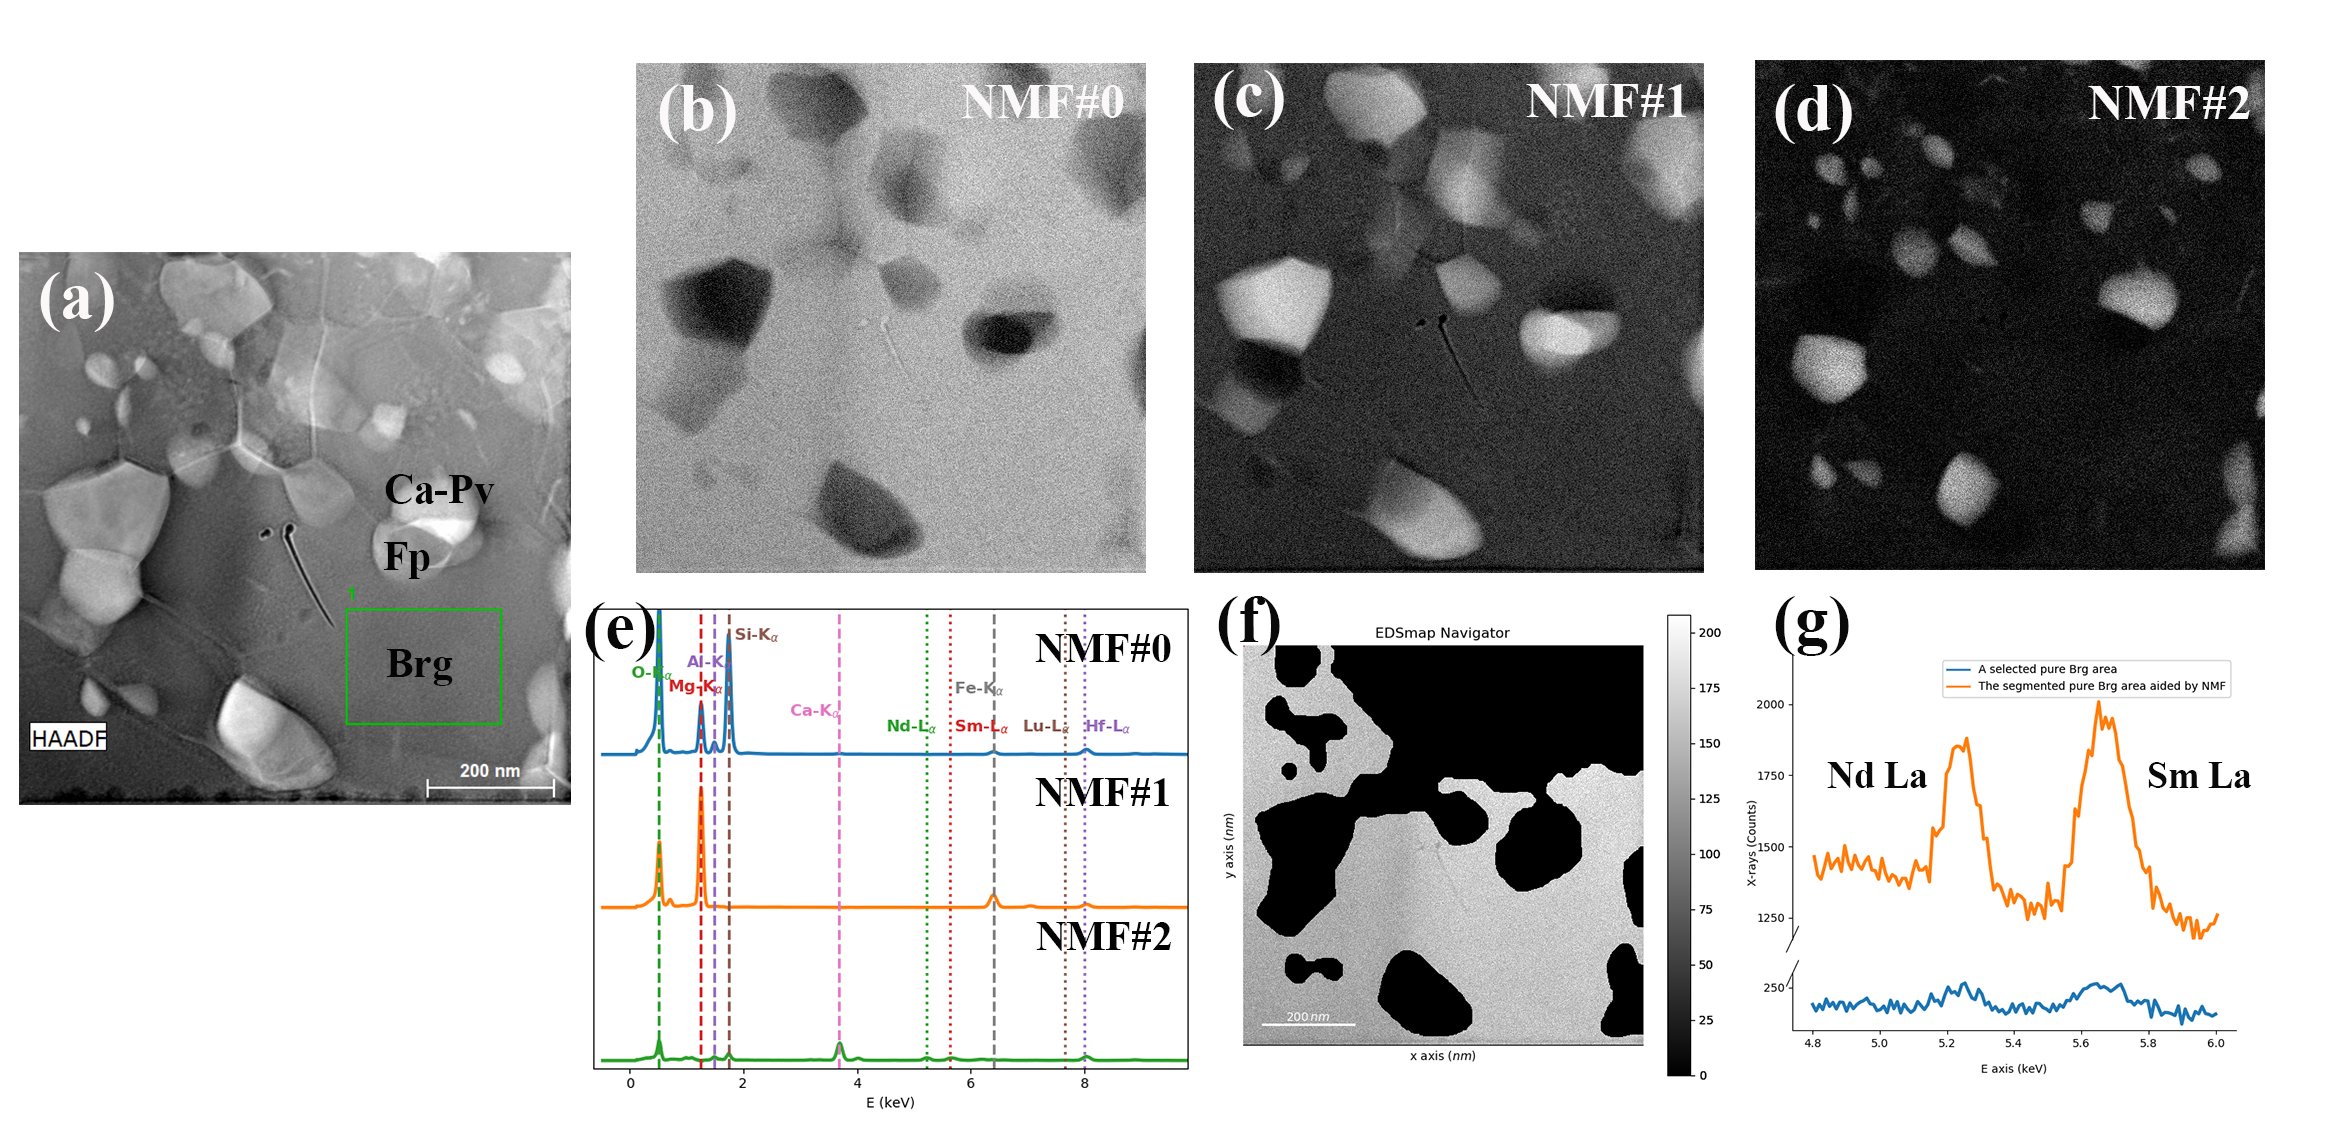
Figure 1(a) is a HAADF image of the 71 GPa sample. Three phases can be identified in the STEM-EDS SI data set: Fp, Brg, and Ca-Pv. All three phases are partly overlapping in the imaged projection, with Brg being the matrix phase. An algorithm called non-negative matrix factorization (NMF) [5] with non-negativity constraint decomposed the acquired STEM-EDS data into 3 components; the resultant loading spectra and score images are shown in Figure 1(b)–(e). NMF#0, NMF#1, NMF#2 correspond Brg, Fp and Ca-Pv, respectively, as indicated by their loading spectra. Though the loading spectra of these components do not completely coincide with the true spectra of the physical phases, owing to a lack of necessary physical constraints in the data decomposition, they reveal a clearer spatial phase distribution between Fp, Brg and Ca-Pv than traditional elemental maps.
Figure 1. (a) HAADF image of the 71 GPa sample; (b)-(d) representative score images and (e) loading spectra from its NMF decomposition; (f) the segmented pure Brg map; (g) spectral comparison between the segmented pure Brg area and a confined Brg area.
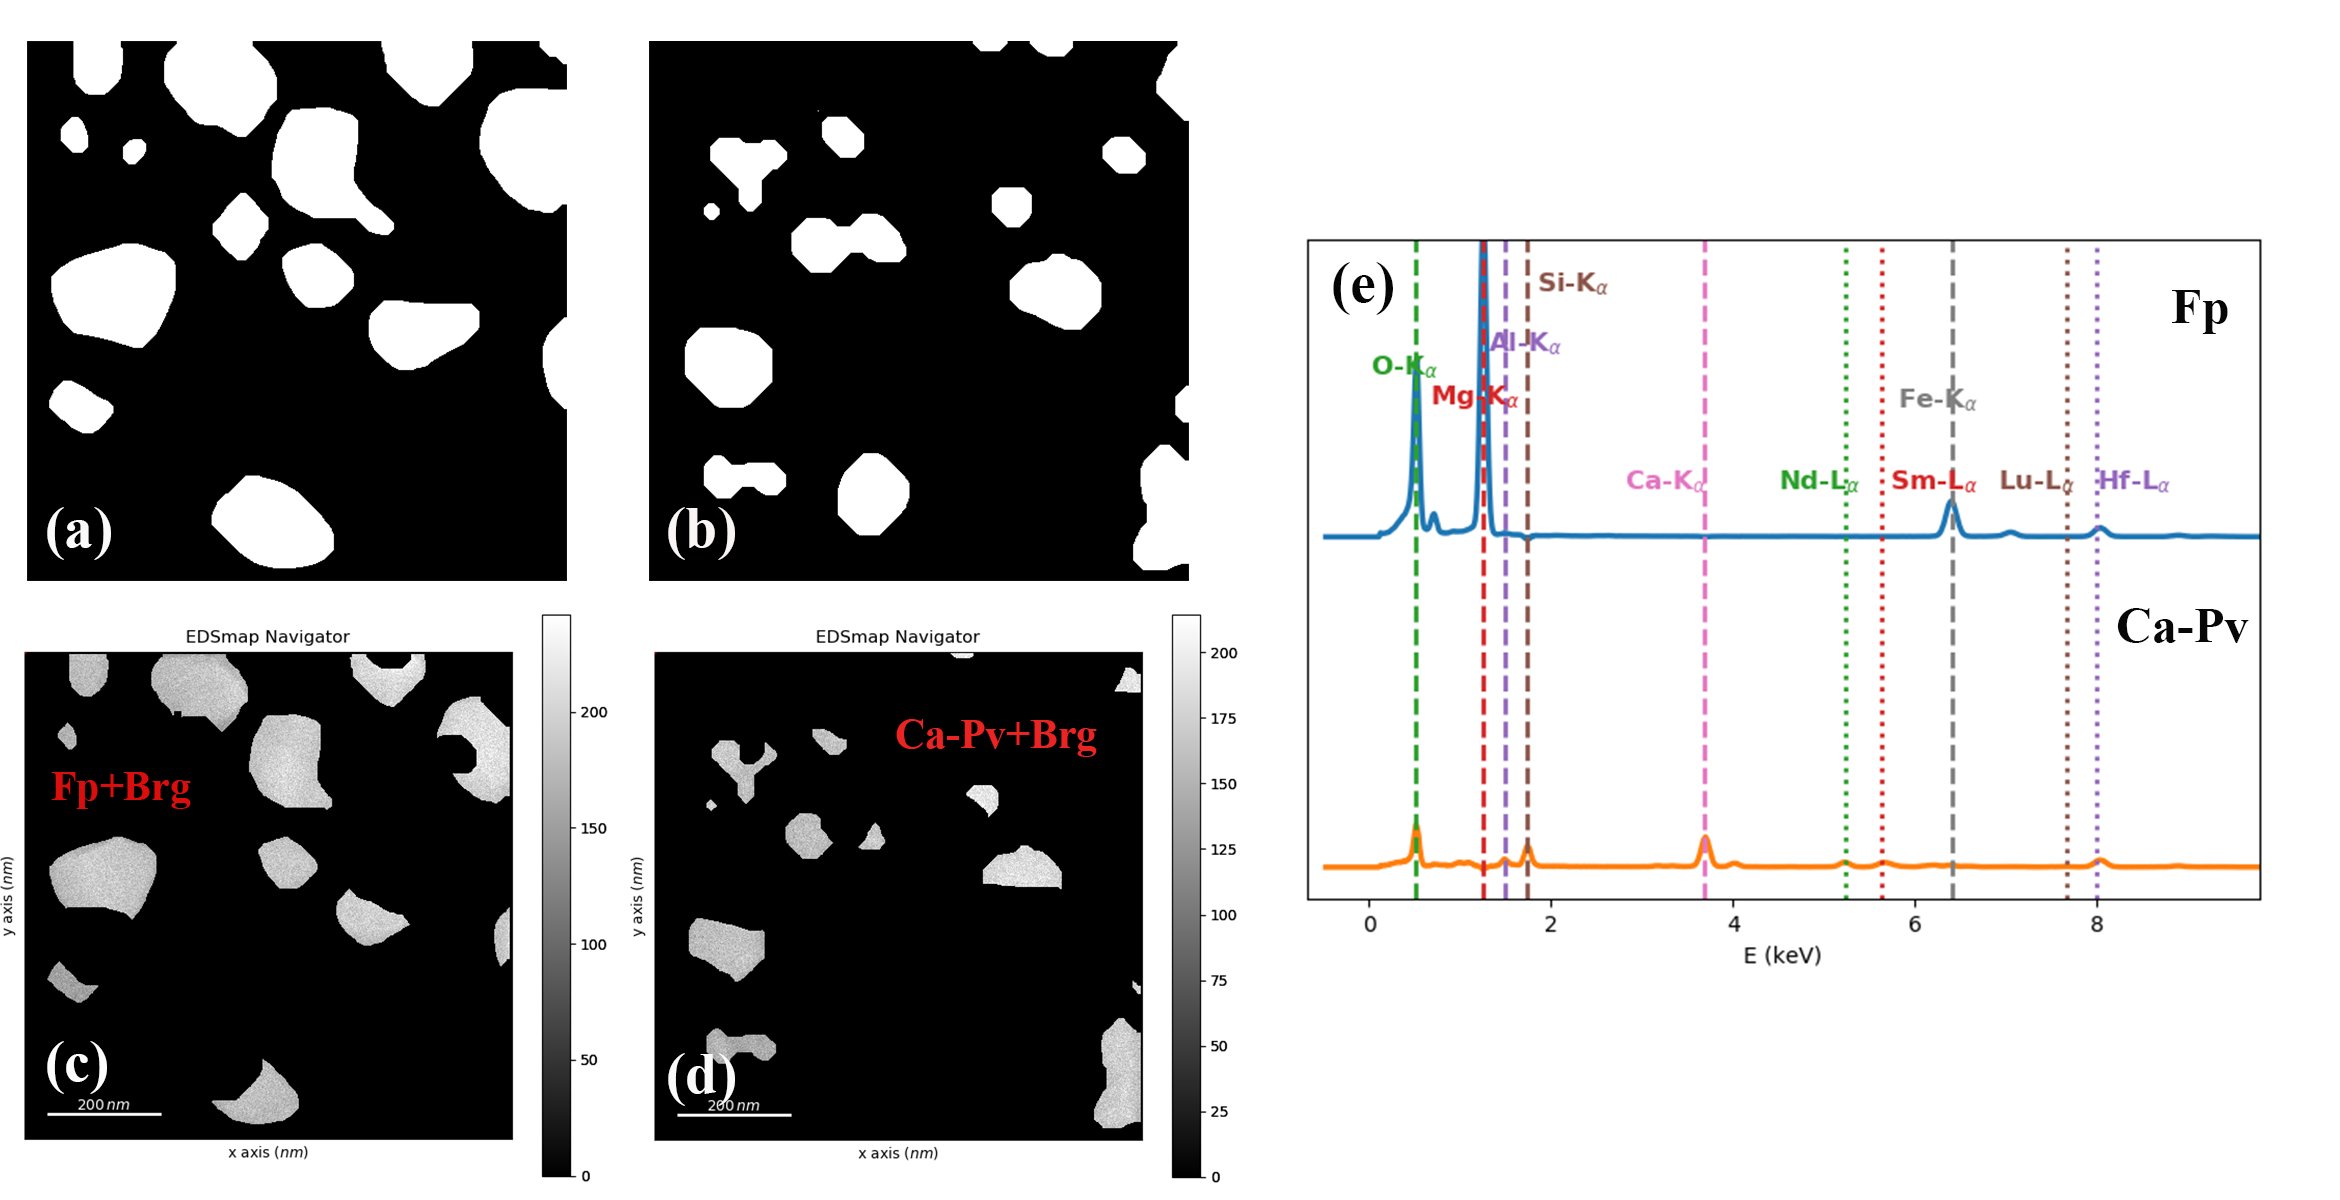
By adding the score images of NMF#1 and NMF#2, it is possible to identify and segment the SI spatial region that corresponds to pure Brg. A trainable Weka using fastRandomForest classifier [6] combined with a global smoothness tuning [7] aid in this process, thereby generating the pure Brg map shown in Figure 1(f). Figure 1(g) compares the Nd La and Sm La EDS signals integrated over this segmented pure Brg area compared to that from a confined region of Brg, as indicated by the green rectangle in Figure 1(a). The full Brg area signal integration clearly gives a much-improved signal to noise ratio for these trace elements. This protocol also applies to the quantification of Fp and Ca-Pv grains, but with some modification because of the overlapping between these two kinds of grains. Figure 2(a) and 2(b) are binary images for labeling Fp and Ca-Pv grains, made from NMF#1 and NMF#2. The intersection of Fp, Ca-Pv, and Brg will be the same as the intersection of Figure 2(a) and 2(b), which should be avoided during the quantification of Fp or Ca-Pv. By eliminating the phase intersections, segmented Fp-Brg mixtures and Ca-Pv-Brg mixtures are demonstrated in Figure 2(c) and 2(d). Finally, by subtracting the Brg contribution from these mixtures, the pure spectra of Fp and Ca-Pv grains are shown in Figure 2(e). Therefore, we have demonstrated that the NMF-aided phase segmentation is an effective method for segmenting spectra from overlapping phases for improved quantification, when applied appropriately. It can further be extrapolated to the data processing of other spectroscopic techniques, such as EELS.
Figure 2. (a) and (b) binary masks for labeling Fp and Ca-Pv grains; (c) Fp-Brg mixtures; (d) Ca-Pv-Brg mixtures; (e) pure Fp spectrum and pure Ca-Pv spectrum.
- References
[1] D Pröfrock et al, Applied Spectroscopy 66 (2012), p. 843–868.
[2] J Badro et al, Earth and Planetary Science Letters 262 (2007), p. 543–551.
[3] J Schmidt et al, npj Computational Materials 5 (2019), no. 83.
[4] AE. Ringwood, Composition and Petrology of the Earth’s Mantle, MacGraw-Hill. 618 (1975).
[5] F de la Pena et al, Microscopy and Microanalysis, 23 (2017), p. 214–215.
[6] https://imagej.net/Trainable_Weka_Segmentation
[7] https://imagej.net/Graph_Cut