Measuring multi-dimensional magnetism by electron magnetic chiral dichroism at the atomic scale
- Abstract number
- 855
- Event
- European Microscopy Congress 2020
- DOI
- 10.22443/rms.emc2020.855
- Corresponding Email
- [email protected]
- Session
- PST.1 - Phase Microscopy
- Authors
- Dr. Dongsheng Song (2), Dr. Jan Rusz (1), Prof. Rafal E. Dunin-Borkowski (2)
- Affiliations
-
1. Department of Physics and Astronomy, Uppsala University
2. Ernst Ruska-Centre for Microscopy and Spectroscopy with Electrons and Peter Grünberg Institute, Forschungszentrum Jülich
- Keywords
electron magnetic chiral dichroism; magnetization; three-dimensional; atomic scale
- Abstract text
At present, the most powerful tomographic techniques for providing three-dimensional magnetic information about materials are based on synchrotron X-rays [1] and transmission electron microscopy (TEM) [2], but only have nm spatial resolution. The technique of electron magnetic chiral dichroism (EMCD) [3] can be used to measure local variations in magnetization in materials with atomic spatial resolution in the TEM [4], but is usually only used to record the component of magnetization in the sample that is oriented in the electron beam direction [5].
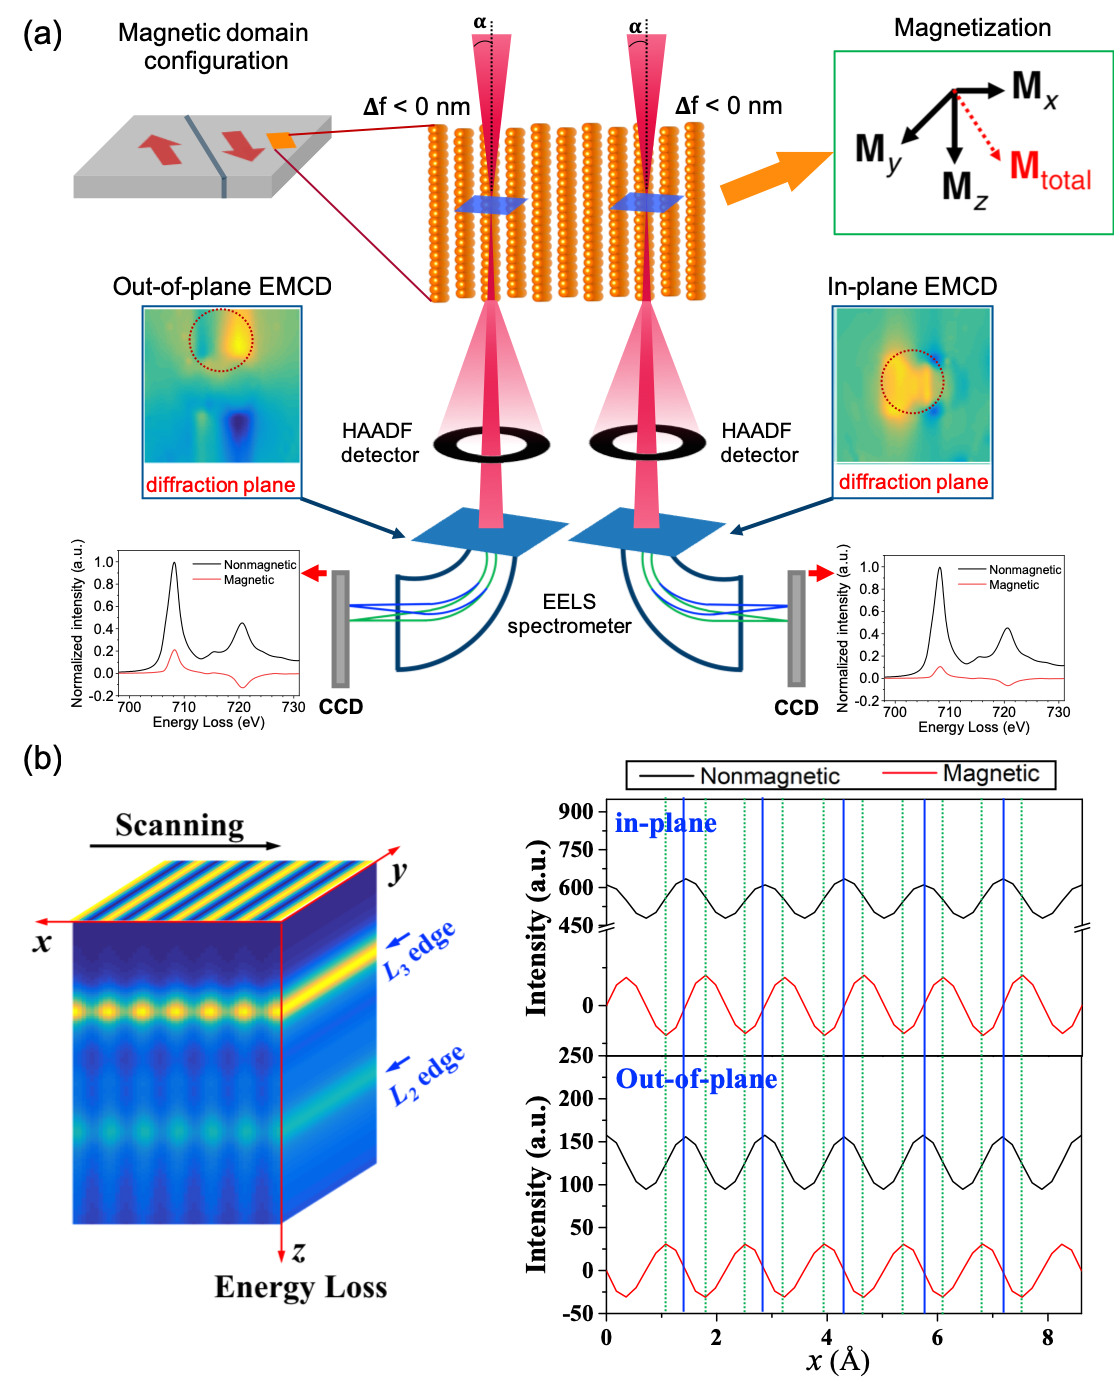
Here, we propose an approach that can be used to measure element-specific magnetic moments in materials in different directions with atomic lateral resolution using EMCD in a probe-corrected scanning TEM (STEM) equipped with electron energy-loss spectroscopy (EELS). A sub-Angstrom electron beam with a specific convergence angle is used to record a position-dependent chiral EELS signal in the form of a spectrum image datacube using the experimental STEM-EELS setup shown in Figure 1(a). In-plane and out-of-plane components of the magnetization in the sample (perpendicular and parallel to the electron beam direction, respectively) can be distinguished by placing the spectrometer entrance aperture in different positions in the diffraction plane. The EMCD signals, which are recorded with atomic plane resolution, are extracted using the approach shown in Figure 1(b) and are found to be enhanced by using a defocused electron beam.
Figure 1 (a) Proposed STEM-EELS setup for measuring magnetization distributions in materials in different directions at the atomic scale. The sample is first tilted to a three-beam orientation. EMCD signals in the diffraction plane that are sensitive to in-plane and out-of-plane magnetization are then recorded with a defocused convergent electron beam and an EELS spectrometer from the positions marked by the red circles. (b) Left panel: Schematic representation of a spectrum image datacube. The x axis is parallel to the scanning direction, the y axis is parallel to the atomic planes, while the z axis is energy loss direction. Right panel: Non-magnetic (black) and magnetic (red) signals plotted along the scanning direction (x axis). The upper and lower panels show in-plane and out-of-plane signals, respectively. The vertical blue lines mark peaks in the non-magnetic signal and correspond to the positions of atomic planes. The green lines on either side of the blue lines mark the positions of maxima and minima in the magnetic signals.
- References
[1] C. Donnelly, M. Guizar-Sicairos, V. Scagnoli, S. Gliga, M. Holler, J. Raabe, and L. J. Heyderman, Microscopy and Microanalysis 24, 80 (2018).
[2] P. A. Midgley and R. E. Dunin-Borkowski, Nature Materials 8, 271 (2009).
[3] P. Schattschneider, S. Rubino, C. Hébert, J. Rusz, J. Kuneš, P. Novák, E. Carlino, M. Fabrizioli, G. Panaccione, and G. Rossi, Nature 441, 486 (2006).
[4] Z. Wang, A. H. Tavabi, L. Jin, J. Rusz, D. Tyutyunnikov, H. Jiang, Y. Moritomo, J. Mayer, R. E. Dunin-Borkowski, R. Yu, J. Zhu, and X. Zhong, Nature Materials 17, 221 (2018).
[5] D. Song, A. H. Tavabi, Z.-A. Li, A. Kovács, J. Rusz, W. Huang, G. Richter, R. E. Dunin-Borkowski, and J. Zhu, Nature Communications 8, 15348 (2017).