Multidimensional electron diffraction of soft materials
- Abstract number
- 587
- Event
- European Microscopy Congress 2020 Invited Speakers
- DOI
- 10.22443/rms.emc2020.587
- Corresponding Email
- [email protected]
- Session
- PST.5 - Diffraction techniques and structural analysis
- Authors
- Duncan N. Johnstone (1), Paul A. Midgley (1)
- Affiliations
-
1. University of Cambridge
- Keywords
crystallography, electron diffraction, scanning electron diffraction, soft matter, metal organic frameworks, molecular crystals
- Abstract text
Soft materials are ubiquitous in established and emerging technologies from organic pharmaceutical crystals and polymers to metal-organic frameworks and organic semiconductors. However, the use of electron microscopy to characterize property determining atomic structure in these materials on the nanoscale (i.e. nanostructure) has been limited by electron beam-sensitivity [1]. Low-dose (ca. 1-10 e/Å2) electron diffraction techniques, namely 4D scanning electron diffraction (4D-SED) [2,3] and 3D electron diffraction (3D-ED) [4], are now emerging as powerful techniques for studying soft nanostructure while avoiding significant electron beam induced damage. These technique developments are being driven forwards by advances in direct electron detection and cryogenic electron microscopy as well as the increasing availability of the computational tools necessary to analyse the resulting multidimensional data. Here, we show how 3D-ED and 4D-SED can be used together and incorporating information obtained from powder X-ray diffraction (PXRD) and ab-initio structure prediction to characterize nanostructure in soft materials.
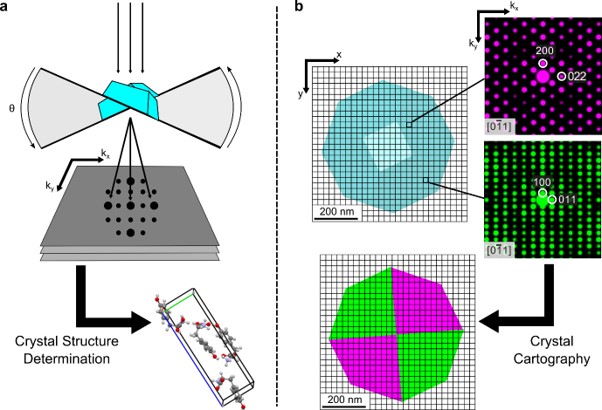
We obtain 3D-ED using the continuous rotation method [5] in which a crystal under parallel electron beam illumination is rotated at a continuous rate, e.g. 1° s-1, while recording diffraction patterns with a fixed exposure time, e.g. 1°, to obtain integrated diffraction patterns over a large angular range, e.g. ±60°, as shown in Figure 1a. Such 3D-ED data may be used for ab-initio structure determination using a variety of methods, which we complement with theoretical predictions obtained using ab-initio random structure searching (AIRSS) [6] and Rietveld refinement of PXRD data to increase confidence in the results obtained. This analysis typically yields the average crystal structure but provides limited insight into any defects present. We then obtain 4D-SED data by scanning a focused but near parallel (ca. 1 mrad convergence angle) electron probe across the specimen to obtain a two-dimensional electron diffraction pattern at every probe position, typically with 2-5 nm spatial resolution. The local diffraction data obtained by 4D-SED can then be analysed [7] to achieve “crystal cartography” mapping local phase and revealing characteristics of crystal defects comprising nanostructure, as shown in Figure 1b.
Results will be presented from several materials systems to illustrate the applicability of the multi-modal approach described above. Firstly, using 3D-ED in complement with PXRD data and AIRSS predictions to solve the structure of a new polymorph of L-tyrosine. Secondly, combining 3D-ED with 4D-SED to determine molecular packing and (optically important) stacking defects in perylene diimide (PDI) organic semiconductor nanobelts. Finally, using 4D-SED to directly image missing metal cluster defect domains in the metal organic framework UiO-66 previously identified using total scattering XRD methods. This work demonstrates how newly developed low-dose multidimensional electron diffraction techniques enable soft materials to be characterized with a new level of detail in real and reciprocal space.
Figure 1: Methods of multidimensional electron diffraction. a, 3D-ED data <θ | kx, ky> recorded by continuous rotation of a nanocrystal under parallel beam electron illumination while recording 2D diffraction patterns may be used for ab-initio crystal structure determination. b, 4D-SED data <x, y | kx, ky> obtained by recording a 2D diffraction pattern at every position in a 2D scan can be used to achieve “crystal cartography” by determining the local crystal phase associated with each diffraction pattern.
- References
[1] R F Egerton, Ultramicroscopy, 127, 100–108 (2013)
[2] O Panova et al., Nature Materials, 18, 860-865 (2019)
[3] D N Johnstone et al., Microscopy & Microanalysis, 25 (S2), 1746-1747 (2019)
[4] M Gemmi et al., ACS Central Science, 5, 1315-1329 (2019)
[5] B L Nannenga et al., Current Opinion in Structural Biology 27, 24-31 (2014)
[6] C J Pickard et al., Journal of Physics: Condensed Matter, 23, 053201 (2011)
[7] D N Johnstone et al., Zenodo, doi: 10.5281/zenodo.2649351 (2020)
[8] The authors acknowledge the large number of people with whom they have collaborated on this work, including: T. Willhammar, K.D.M. Harris, C.J. Pickard, S. Collins, A. Rao, R. Pandya, M. Cliffe, F. Firth, C. Grey and other members of their respective research groups.