Nanoscale Automated Quantitative Mineralogy: A 200 nm Quantitative Mineralogy Assessment of Fine-grained Material with Mineralogic
- Abstract number
- 675
- Event
- European Microscopy Congress 2020
- DOI
- 10.22443/rms.emc2020.675
- Corresponding Email
- [email protected]
- Session
- PSA.6 - Geological Materials & Bio-mineral systems
- Authors
- Nynke Keulen (1), Shaun Graham (2), Adam Garde (1), Sneha Ray Sarkar (3), Sebastian Malkki (1)
- Affiliations
-
1. 1 Department of Petrology and Economic Geology, Geological Survey of Denmark and Greenland (GEUS), Øster Voldgade 10, DK-1350
2. 2 Carl Zeiss Microscopy GmbH, ZEISS Group, 50 Kaki Bukit Place, 415926
3. Globe Institute, University of Copenhagen. Øster Voldgade 5, DK-1350
- Keywords
automated quantitative analysis (AQM); spectrum quantification; signal deconvolution; 200-nm resolution; grain size distribution; mineral maps;
- Abstract text
Effective energy-dispersive X-ray spectroscopy analysis (EDX) with a scanning electron microscope (SEM) of fine-grained materials (submicrometer scale) is hampered by the interaction volume of the primary electron beam, whose diameter usually is larger than the size of the grains to be analyzed. Therefore, mixed signals of the chemistry of individual grains are expected, and EDX is commonly not applied to such fine-grained material. However, by applying a low primary beam acceleration voltage, combined with a large aperture, and a dedicated mineral classification in the mineral library employed by the Zeiss Mineralogic software platform, mixed signals could be deconvoluted down to a size of 200 nm. In this way, EDX and automated quantitative mineralogy (AQM) can be applied to investigations of submicrometer-sized grains. It is shown here that reliable quantitative mineralogy and grain size distribution assessment can be made based on three Greenlandic examples with fine grained material; fault gouge with a heterogenous mineralogy, fine needles in glass particles, and rock flour comminuted by glacier activity. Here, we show the capability to map the mineralogy and investigate the grain size of fine-grained material at a 200-nm spatial EDX resolution [1]. This is believed to be the first recorded example of successful AQM analyses of fine-grained geological material at such a fine detail.
AQM has been available since the early 1980s with technologies such as QEMSCAN [2] and the more recent TIMA-X[3]. These automated mineralogy techniques control the electron beam to step across the sample surface, at a user-defined spatial resolution acquiring unquantified energy-dispersive spectroscopy EDX spectrum. This unprocessed (no matrix corrections or spectrum quantification) spectrum is matched to a list of known referenced EDX spectra to provide a mineral name [3]. Whilst this technique is widely applied within AQM, it only provides a “crude” assessment of the mineralogy where elemental concentrations exceed 10 wt.% [4]. As such, this historic methodology falls short of providing a direct chemical analysis or correct analytical procedure to provide the necessary quality of analysis or standardized results.
The development of ZEISS’ Mineralogic provides a step change in the analytical capabilities of AQM with the integration of these new EDX capabilities. This AQM software acquires an EDX spectrum, and performs matrix corrections and peak deconvolution for each analysis point. Minerals are subsequently classified based on stoichiometry values [5]. The chemistry in each pixel is saved by the Mineralogic software, and the pixel’s mineralogy can therefore be reinterpreted after the analysis. Each EDX analysis provides one pixel on the false-colored mineral map [5].
In dispersive spectrometry, fundamental electron beam interaction with the sample still poses challenges, especially at low spatial resolutions. X-rays are generated from an interaction volume, which size is a function of the primary energy of the beam and the mean atomic number of the sample [6]. In geological samples, typically containing silicates, interaction volumes can be in a region of 2–5 µm, with a 20-kV primary electron beam. Therefore, providing a chemical analysis and mineral classification based on an EDX spectrum can be challenging for fine-grained material, due to the “mixing” of compositions of a number of grains. There is little alternative substitute for the quantification of fine-grained mineral assemblages, as gray level alone is not enough to separate and quantify the mineralogy and textures.
The fine-grained material was studied in a polished thin section that was coated with carbon and studied with a Zeiss SIGMA 300VP SEM equipped two Bruker XFlash 6ǀ30 EDX detectors with 129-eV energy resolution and with the Zeiss Mineralogic AQM mineralogy software platform. A region was selected and imaged to provide a high-resolution back-scattered electrons contrast mosaic. In addition, on this region of interest, a 200-nm step-size AQM analysis was carried out using Mineralogic, creating a mineral map (Figure 1).
The acceleration voltage of the primary electron beam was set to 10 kV to reduce the interaction volume [7], and therefore to minimize the amount of mixed pixel data, and a 60-µm aperture providing a 1.8-nA beam current was applied. Despite this reduction to 10 kV, Monte Carlo simulations for the interaction volume yield a diameter of up to approximately 1 µm for minerals with the lowest average atomic number (Z) and down to 400 nm to for a high Z phases [8], and a 200-nm EDX pixel size would greatly provide oversampling and a large volume of mixture pixel signatures.
Due to the access to fully quantitative EDX classifications for each pixel within the Mineralogic software and the ability to quantify the weight percent contribution of the elements present on a per-pixel basis [5], the creation of highly discriminatory mineral classifications is enabled whereby “contamination” of the chemical analysis provided by the mixed signals were able to be identified and factored into the mineral classifications of the mineral library (Figure 1).
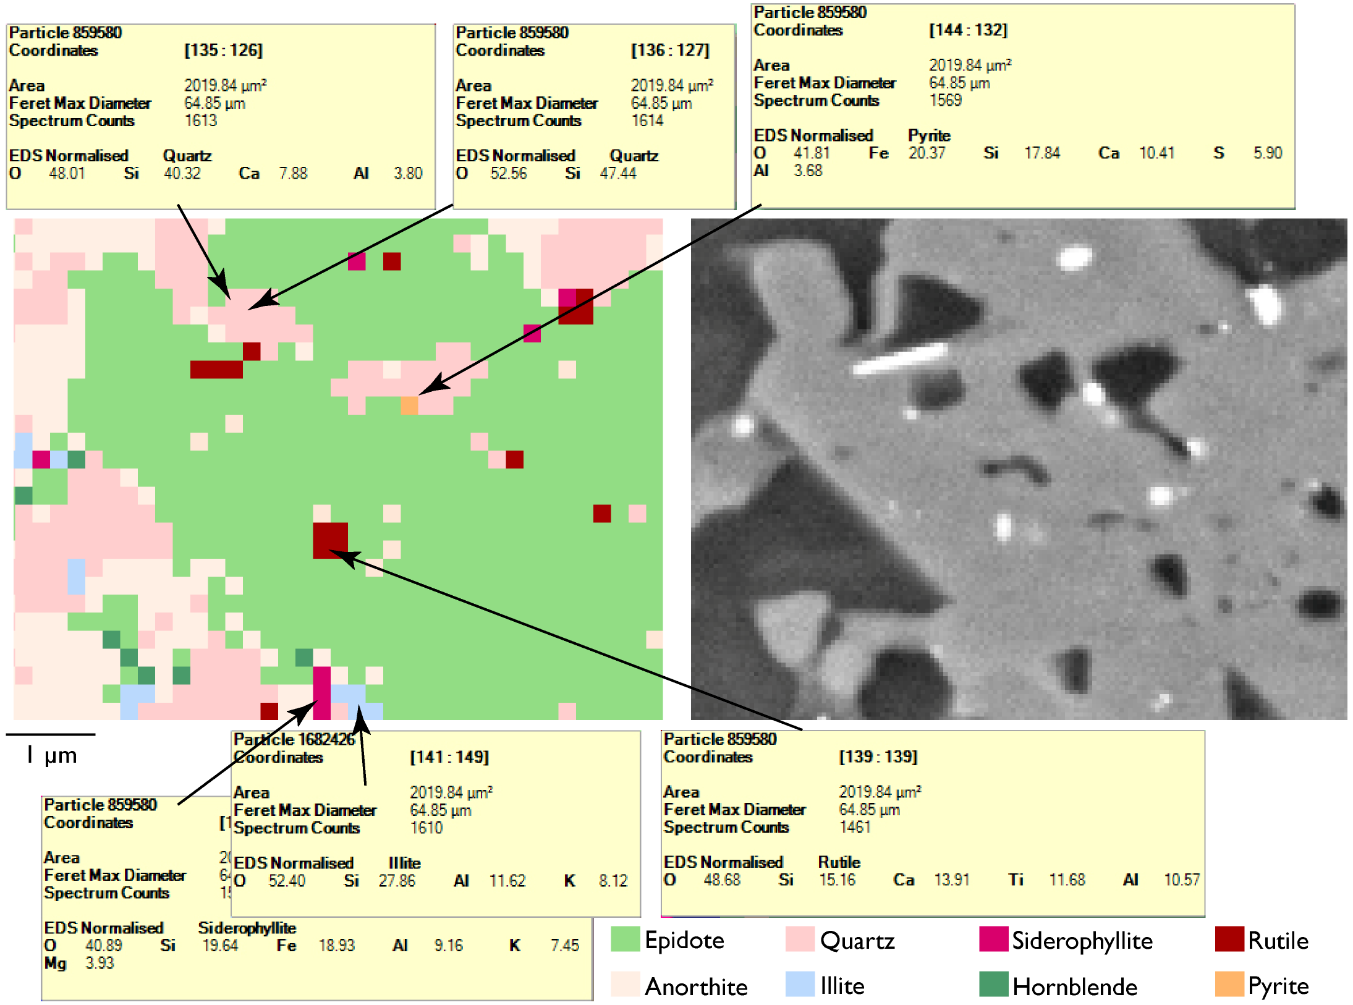
Figure 1. Detailed view of a false-colored mineral map and the associated BSE image. Each pixel represents 200 × 200 nm. Grains of 200 nm can be recognized and classified from the EDX data for that pixel. Yellow boxes display example EDX normalized weight percentages and the interpretation of the operator for the mineralogy. Figure reproduced from Minerals 2019, 9, 665; doi:10.3390/min9110665.
Even for minerals with a low Z (high interaction volume), a large part of the chemical information comes from the area where the beam hits the sample. Monte Carlo simulations at 10kV show that for all the investigated cases, 50% of the electron trajectories remain within a 75–160-nm wide interaction volume area and reach depths of maximum ca. 200–300 nm. Therefore, the mixed signals could successfully be identified and translated into classifications in the mineral library that enable the correct classification of those particles (Figure 1).
The ability to quantify the EDX spectrum at each analyzed point into its primary chemical components, and the use of in-built matrix corrections and peak deconvolutions, provide a robust analytical framework to provide high-quality quantitative chemical data that have never before been possible in AQM.
- References
1. Graham, S.; Keulen, N. Nanoscale Automated Quantitative Mineralogy: A 200-nm Quantitative Mineralogy Assessment of Fine-grained Fault Gouge Using Mineralogic. Minerals 2019, 9, 665; doi:10.3390/min9110665.
2. Sutherland, D.N.; Gottlieb, P.; Application of automated quantitative mineralogy in mineral processing. Min. Eng. 1991, 4, 753–762.
3. Hrtska, T.; Gottlieb, P.; Skála, R.; Breiter, K.; Motl, D. Automated mineralogy and petrology—Applications of Tescan Integrated Mineral Analyzer (TIMA). J. Geosci. 2018, 63, 47–63.
4. Andersen, J.C.Ø.; Rollinson, G.K.; Snook, B.; Herrington, R.; Fairhurst, R.J. Use of QEMSCAN® for the characterization of Ni-rich and Ni-poor goethite in laterite ores. Min. Eng. 2009, 22, 1119–1129.
5. Keulen, N.; Malkki, S.N.; Graham, S. Automated quantitative mineralogy applied to metamorphic rocks. Minerals 2020, 10, 47; doi:10.3390/min10010047.
6. Goldstein, J.I.; Newbury, D.E.; Michael, J.R.; Ritchie, N.W.M.; Scott, J.-H. J.; Joy, C.C. Scanning Electron Microscopy and X-Ray Microanalysis; Springer: New York, NY, USA , 2017; p. 550.
7. Hombourger, C.; Outrequin, M. Quantitative Analysis and High-Resolution X-ray Mapping with a Field Emission Electron Microprobe. Microsc. Today 2013, 21, 10–15, doi:10.1017/S1551929513000515.
8. Drouin, D.; Couture, A.R.; Joly, D.; Tastet, X.; Aimez, V.; Gauvin, R. CASINO V2.42—A fast and Easy-to-use modeling tool for scanning electron microscopy and microanalysis users. Scanning 2007, 29, 92–101.