Nanoscale origins of degradation of Ni-rich NMC Li-ion battery cathodes
- Abstract number
- 414
- Event
- European Microscopy Congress 2020
- DOI
- 10.22443/rms.emc2020.414
- Corresponding Email
- [email protected]
- Session
- PSA.4 - Batteries & Materials for Energy Conversion
- Authors
- Mr Jedrzej Morzy (1, 2), Dr Wesley Dose (2), Dr Amoghavarsha Mahadevegowda (1), Dr Michael de Volder (2), Prof Caterina Ducati (1)
- Affiliations
-
1. Electron Microscopy Group, Dept. of Materials Science and Metallurgy, University of Cambridge
2. Nanomanufacturing Group, Insitute for Manufacturing, University of Cambridge
- Keywords
EELS, electrochemistry, electron microscopy, Li-ion batteries
- Abstract text
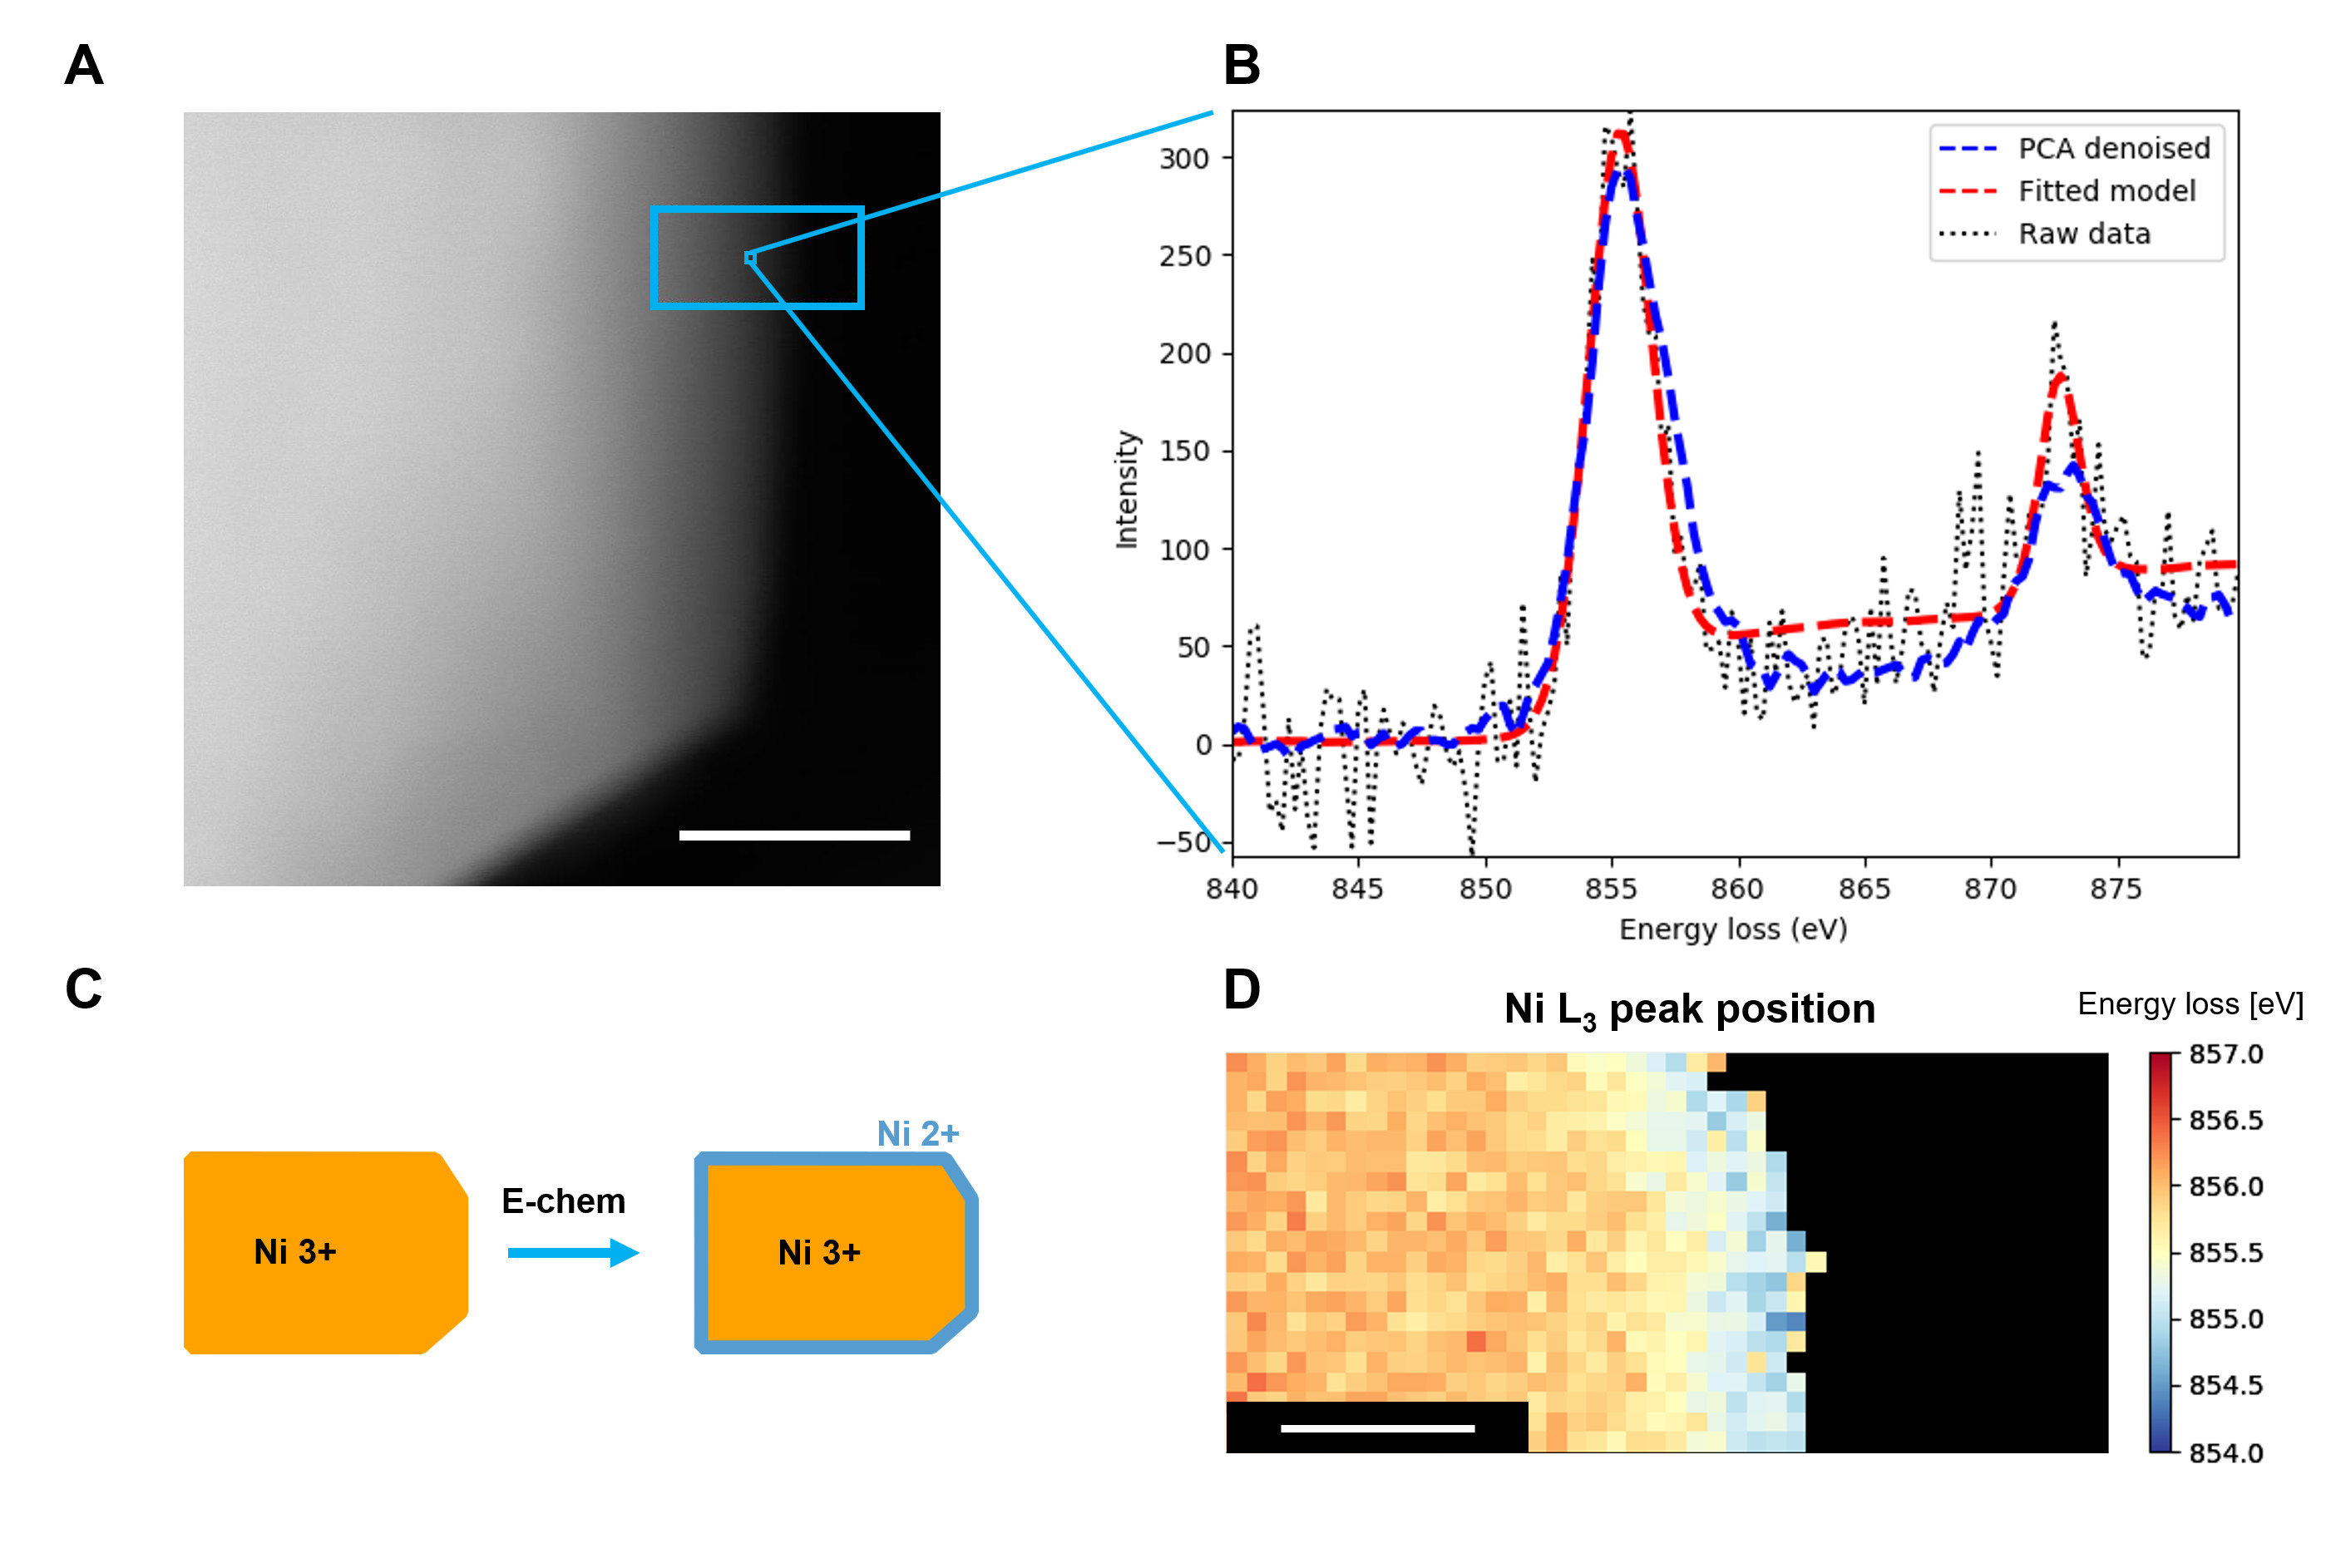
Ni-rich cathode materials for Li-ion batteries such as LiNi0.8Mn0.1Co0.1O2 (NMC811) exhibit high volumetric and gravimetric specific capacities and low cost compared to other, isostructural materials with lower nickel content, which makes NMC811 a strong candidate for new generation of cathodes for Li-ion batteries. However, these layered transition metal oxides suffer from complex degradation mechanisms, such as surface reconstruction to spinel and rock-salt phases, cathode-electrolyte interphase formation, cracking, oxygen release and transition metal dissolution, which are exacerbated by high Ni content.[1-3] Here, we use carefully designed electrochemical protocols (varying the time at high voltages, upper cut-off voltage, degree of (de)lithiation, frequency of phase transformations) aiming to decouple various degradation mechanisms. Based on full cell (NMC811 vs graphite) cycling data, coupled with area specific impedance from electrochemical impedance spectroscopy and hybrid pulse power characterisation, we report that the time at high voltages (even at 4.3 V) does not cause significant impedance rise, while the most severe cell capacity loss and impedance rise is present when the cells are cycled to >4.2 V during cycling. Moreover, capacity fade and impedance rise are also higher when the high upper cut-off voltage cycling is combined with large state-of-charge changes. We complement the electrochemical data with electron microscopy of pristine and electrochemically stressed NMC811. We use scanning transmission electron microscopy ((S)TEM) imaging and electron energy loss spectroscopy (EELS) in a FEI Tecnai Osiris operated at 200 kV, and probe the local, nanoscale chemistry of NMC811 particles. This is aimed at identifying the structural, morphological and oxidation state changes occurring as a result of the electrochemical history. In this work, we use both model fitting and multivariate statistical analysis (such as principal component analysis – PCA) of the same EELS spectrum images (Fig. 1).[4] Multivariate statistical analysis is used as an exploratory tool where it helps guide the model fitting, denoise data prior to fitting, as well as allows to extract representative spectra and their spatial distributions from structural phases present in the sample in a faster, less work intensive manner, which then can be used as a guide to choosing appropriate regions of the spectrum image to average and perform further, traditional analysis. We adopt this approach to study the surfaces of NMC811 in order to determine the effect of electrochemical history on surface layers. A combination of electron microscopy techniques and targeted electrochemical protocols allows for identification of the main causes for impedance rise in NMC811-graphite full cells, in terms of the cathode-electrolyte interphase and reconstruction layers.
Figure 1. (A) Annular dark field STEM image showing a region from which a spectrum image was collected (scale bar 50 nm); (B) a typical spectrum from a single pixel in the spectrum image – cropped to show the Ni edge. Black curve shows raw data, red curve – fitted model and blue curve – PCA denoised data; (C) schematic diagram of changes to the surface of a NMC811 particle during electrochemical stressing; (D) an example map of Ni L3 peak energy loss position from the region highlighted in (A), which indicates a reduced phase on the surface of the particle. Scale bar is 10 nm.
- References
[1] F. Schipper et al., J. Electrochem. Soc. 164 (2017), A6220.
[2] A. Tornheim et al., Nano Energy 55 (2019), 216-225.
[3] Q. Lin et al., Nano Energy 54 (2018), 313-321.
[4] F. de la Peña et al., HyperSpy v1.5.2, hyperspy.org.
[5] We acknowledge the ISCF Faraday Challenge project: “Towards a Comprehensive Understanding of Degradation Processes in EV Batteries” for funding under EP/S003053/1. JM also gratefully acknowledges funding from EPSRC Cambridge NanoDTC, EP/L015978/1