Quantifying Morphology of Mesoporous Materials by Electron Tomography
- Abstract number
- 1223
- Event
- European Microscopy Congress 2020
- DOI
- 10.22443/rms.emc2020.1223
- Corresponding Email
- [email protected]
- Session
- DHA.2 - Advances in 3-dimensional image reconstruction
- Authors
- Xiaohui Huang (1, 3), Wu Wang (1, 3), Dr. Di Wang (1, 2), Prof. Christian Kübel (1, 2, 3)
- Affiliations
-
1. Karlsruhe Institute of Technology
2. Karlsruhe Nano Micro Facility
3. Technical University Darmstadt
- Keywords
Mesoporous materials, Quantification, Electron tomography, DART
- Abstract text
Much attention has been paid to mesoporous materials because of their high surface area, variable pore structure and large pore volume, which is essential for application in separation, purification, energy storage and in catalytic processes1. Compared with bulk techniques such as physisorption or small angle X-ray diffraction, which provide an average measure of the pore structure and pore volume based on assumptions on the pore shape and connectivity, electron tomography has been demonstrated to provide accurate quantifiable 3D structural information at the nanoscale2.
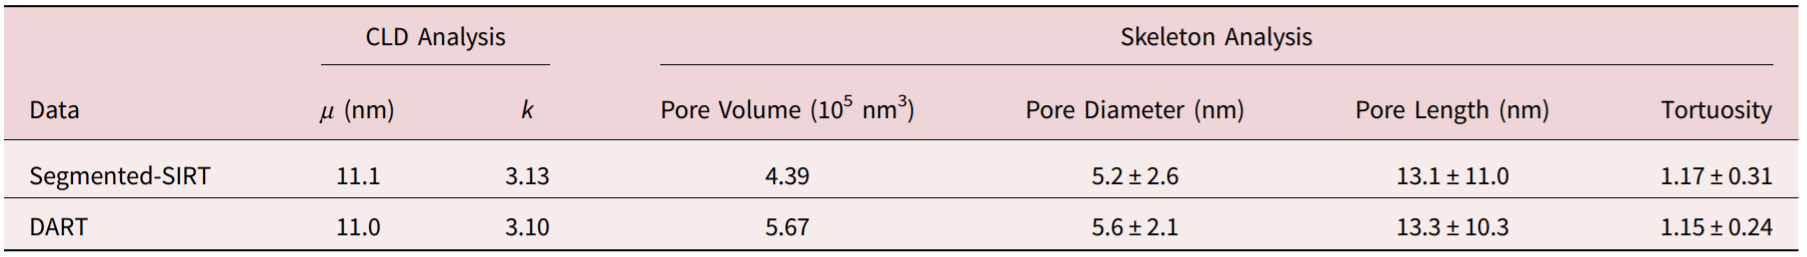
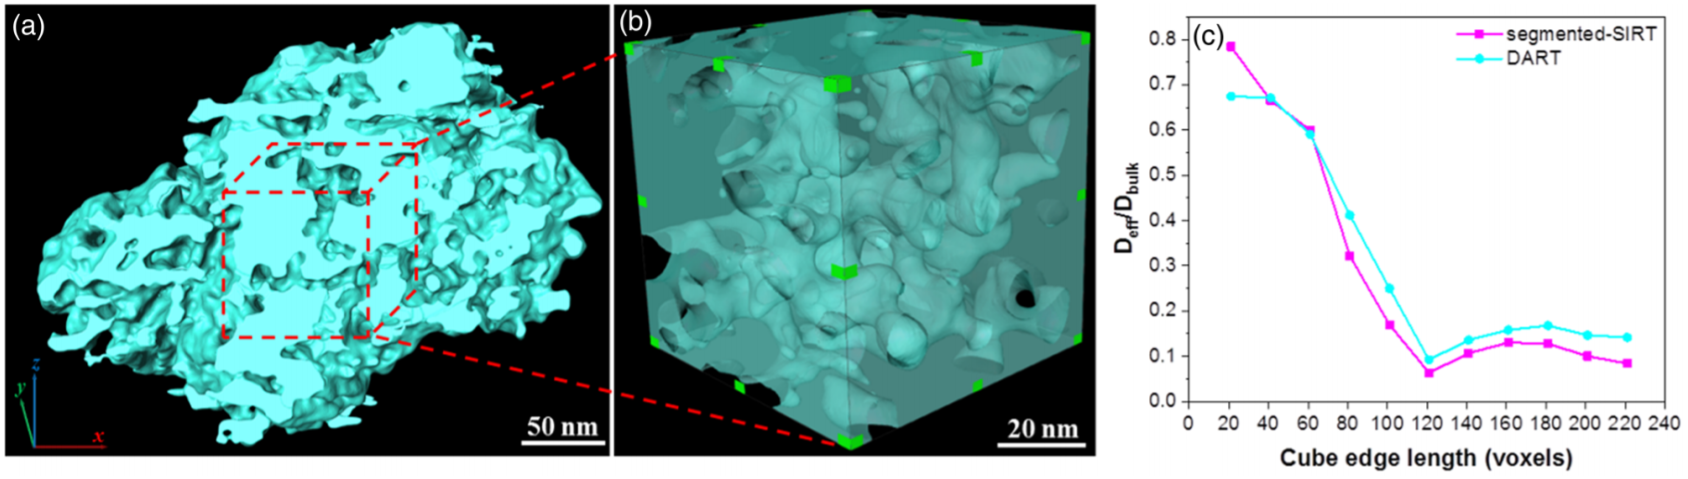
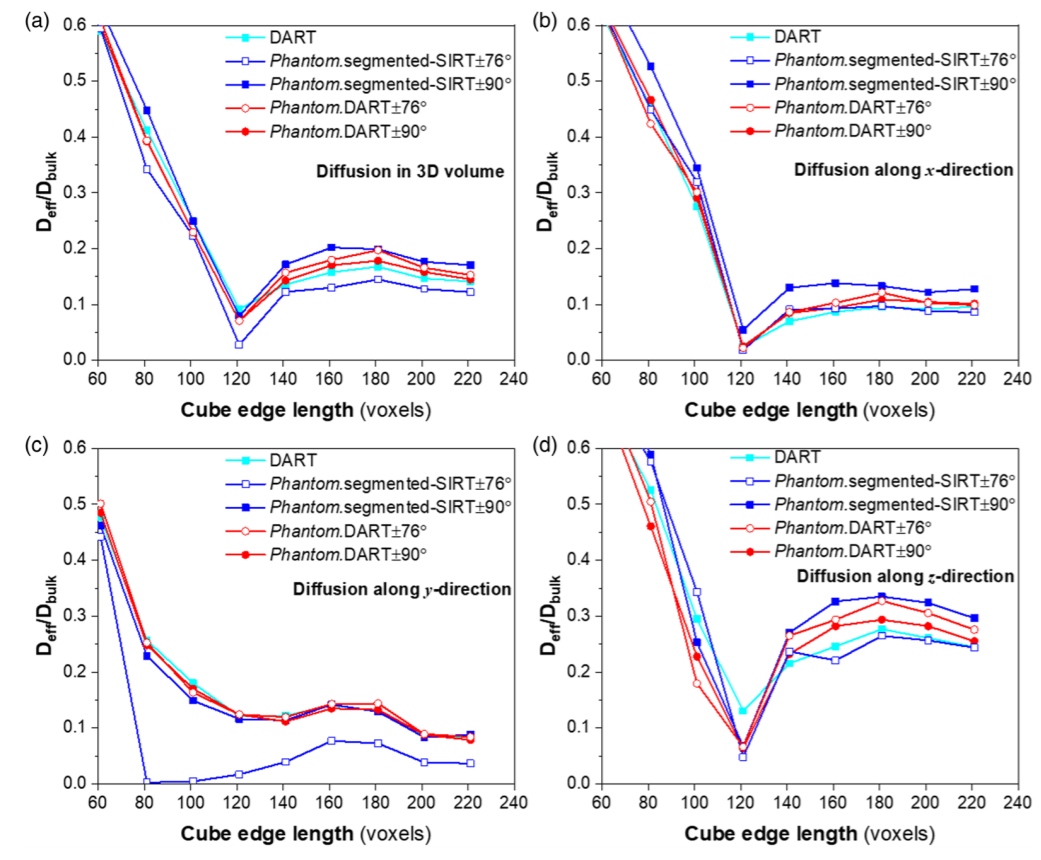
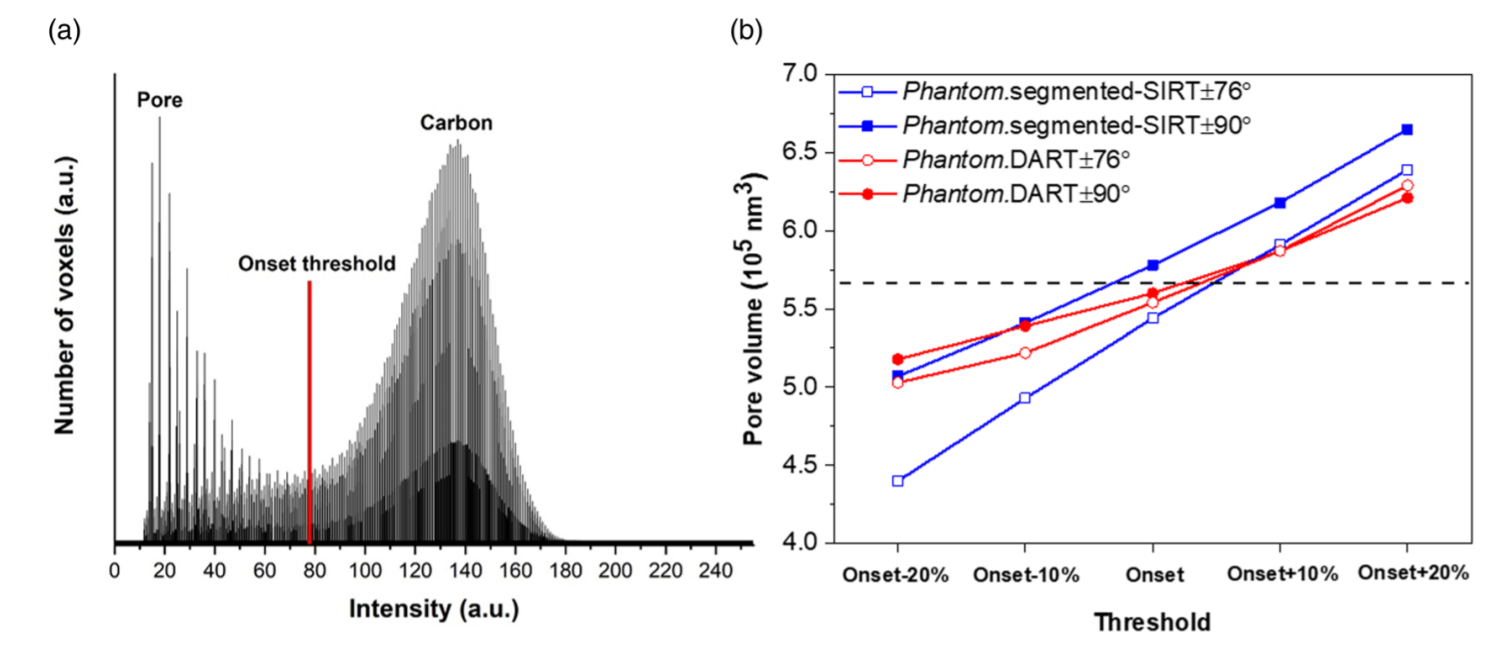
In previous work, we have quantitatively analyzed the morphology and the diffusion properties of a disordered mesoporous carbon material based on electron tomography. The fidelity of the segmented 3D object obtained from the Simultaneous Iterative Reconstruction Technique (SIRT) followed by image processing and with the Discrete Algebraic Reconstruction Technique (DART) is investigated using both experimental data and realistic phantoms for the material3. The CLD and skeleton analysis in Table 1 indicated that the overall morphology of these two reconstructions is similar and independent of the reconstruction methods. However, the total pore volume of the DART reconstruction differs noticeably (~25%) from the segmented SIRT reconstruction, which leads to a huge difference of the simulated diffusion coefficients (∼50%), as shown in figure 1c. Moreover, a phantom study based on the reconstructed mesoporous carbon indicated that the missing wedge artifacts result in a noticeable anisotropy of the measured x-, y- and z-components of the diffusion coefficients in the SIRT reconstruction, while this anisotropy is strongly reduced in the DART reconstruction (Figure 2), but still noticeable. This indicates that a reasonable quantitative analysis of the pore structure of a mesoporous materials using DART based electron tomography reconstructions is possible. However, despite the good performance demonstrated above, applying DART in practice is still a challenging and time consuming process, especially for the manually estimation of discrete gray values that correspond to each composition. Figure 3 showed the effect of threshold chose on the reconstructed pore volume within phantom-based SIRT and DART reconstruction. The pore volume determined from both techniques are sensitive to the threshold setting, which means trial-and-error is involved in order to achieve reasonable results. Therefore, an automatic estimation of the gray values and a better start-reconstruction with less noise and more sparse intensity for the DART reconstruction, already providing a good approximation of the morphology, is required not only for saving time but for more reliable quantification results. Currently, we are developing other reconstruction approaches as starting point for DART algorithm and extend it to other mesoporous materials for a quantitative analysis. Moreover, a deeper understanding of structure and properties for mesoporous materials is expected by combining electron tomography with bulk characterization techniques.
Table 1. Morphological descriptors for the pore structure of the segmented-SIRT and DART reconstructions.
Figure 1. (a) Overall 3D morphology of the mesoporous carbon particle, (b) cubic substructure used for the diffusion simulations and (c) calculated effective diffusion coefficients normalized by the bulk diffusivity depending on the cube edge length for the segmented-SIRT and the DART reconstruction.
Figure 2. Effective diffusion coefficients normalized by the bulk diffusivity as a function of the simulation box size. (a) 3D, (b) x-component, (c) y-component and (d)z-component.
Figure 3. Intensity histogram of a 3D reconstruction showing two main peaks corresponding to pore (void) and carbon (solid); (b) effect of threshold on the reconstructed pore volume within Phantom.segmented-SIRT and the Phantom.DART reconstructions (the dashed line indicates the pore volume of the reference phantom).
- References
[1] Liang C, Li Z & Dai S; Angew Chem – Int Ed, 2008, 47, 3696–3717.
[2] Midgley PA & Dunin-Borkowski RE, Nat Mater, 2009, 8, 271–280.
[3] W. Wang, A. Svidrytski, D. Wang, A. Villa, H. Hahn, U. Tallarek, C. Kübel; Microscopy & Microanalysis, 2019, 25, 891-902.