Secondary Electron Hyper Spectral surface imaging for beam sensitive biomaterial characterisation
- Abstract number
- 98
- Event
- European Microscopy Congress 2020
- DOI
- 10.22443/rms.emc2020.98
- Corresponding Email
- [email protected]
- Session
- PST.4 - Spectroscopies in Electron, X-ray and Ion Microscopy
- Authors
- Mr Nicholas Farr (2), Dr Fodio Longman (2), Dr Gareth Hughes (1), Dr Nicola Green (2), Dr Frederik Claeyssens (2), Dr Cornelia Rodenburg (2)
- Affiliations
-
1. University of Oxford
2. University of Sheffield
- Keywords
Polymeric biomaterials, Surface modification, Secondary electron emission, Secondary electron hyperspectral imaging
- Abstract text
Summary:
Is there spectroscopy method that can reveal local cross-linking variations at the nano- and micron scale on the surface of biomaterials? Such a technique would be transformative for biomaterial characterisation if it can be carried out with ease. One of the most straightforward and widely used electron microscopes is the Scanning Electron Microscope (SEM) in the Secondary Electron (SE) imaging mode. Here we demonstrate SE Hyperspectral Imaging (SEHI) can be used to map functional groups involved in polymer cross-linking.
Introduction:
A biomaterials mechanical properties are defined by its underlying chemical and structural relationships whose local variations determine cell growth propensity. For this reason, novel surface chemical spectroscopy and imaging methods on nano- and micro-scale levels are needed. In particular, crosslinking density and local variations in molecular order are major contributors to a biomaterials mechanical properties and consequently the biocompatibility of the material. Established averaging methods for the estimation of molecular order and crosslinking density do not provide information of their spatial distributions within the biomaterials. Here we show that SEHI can provide the necessary spectral information and that can also be exploited for SE imaging.
Methods/Materials:
The low molecular weight PGS-M polymer was fabricate following the recipe from Pahneh-Tala et al [1]. Observation of the surface morphology of the PGS-M samples was performed using a Scanning Electron Microscope (FEI Nova Nano 450 SEM). To avoid surface charging and consequent damage to the sample, a low accelerating voltage (1 KV) with typical vacuum pressure of 10−5 mbar at a working distance of 3mm was applied. The FEI Nova Nano 450 SEM is provided with a through lens detector which includes a voltage controlled deflector electrode. The deflector electrode channels the signal into the SE detector. The deflector electrode is set to a predetermined number of deflector voltages and an image is generated for each deflector voltage. Spectra and hyperspectral images are acquired through post-processing of such image series. PGS-M was synthesised at varying degrees of methacrylation content which leads to average hardness/crosslinking changes as well as changes in vibrational spectroscopy (Raman) of CH vibrations as result of cross-linking. Therefore, this system was chosen to establish the SE energy region that responds to CH vibrations by correlating Raman and SE intensities. Component analysis confirmed this but also provides CH vibration maps.
Results and Discussion:
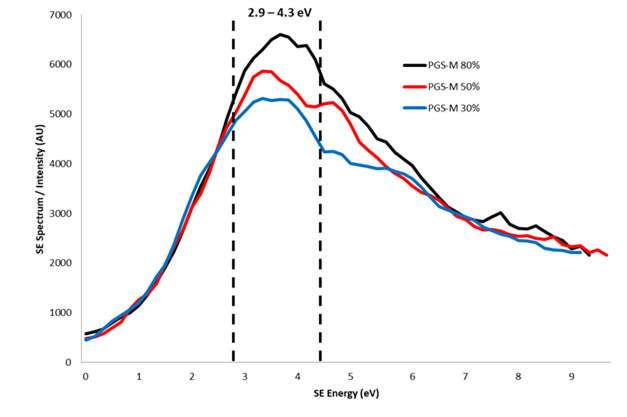
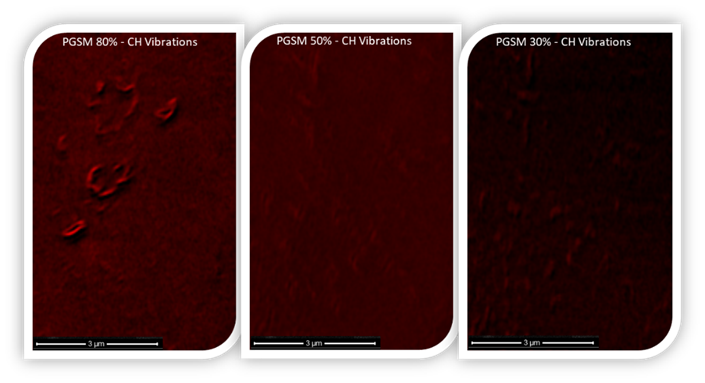
Figure 1 shows the SE spectra of PGS-M produced with different degrees of methacrylation, which exhibit different intensity peaks at different energy levels. For the polymer system (PGS-M) SE spectra vary strongly in the SE energy region of 2.3 – 4.3 eV. A change in the average content of CH groups can be seen for each degree of the methacrylation and is consistent with that identified through historical Raman spectra [2]. What Raman cannot reveal is the local variation of CH vibration that takes place at different length scales for different Methacrylate content. Figure 2 shows SEHI images obtained from component analysis of PGS-M spectra with varying degrees of Methacrylate content. It is clear from the SEHI images that the emission of CH bonding increases with the degree of methacylation. SEHI images uniquely show variation in local CH vibrations across the PGS-M surfaces. CH vibration variation is expected to reveal information of the crosslinking extent and structure within the material as the degree in methacrylation is varied. This is considered to be important as a biomaterial's crosslinking density is closely coupled to its ability to promote cell growth through the local surface variations resulting from the differing polymer side chains.
Conclusion:
We have demonstrated that using SEHI it is possible to map CH variation with ease in the scanning electron microscope. SEHI images show that cross-linking and thus hardness is also likely to change locally as variation in CH vibrations. This work therefore proposes an innovative surface approach to providing researchers with effective tools to visualise and characterise novel biomaterials in the SEM.
Figure 1 - Secondary electron spectra for 30%, 50% and 80% Low Mw PGS-M. [2]
Figure 2 - Utilising SEHI to map CH bonding as a measure of crosslinking within a polymer derived biomaterial.
- References
- S. Pashneh-Tala, R. Owen, H. Bahmaee, S. Rekštyte, M. Malinauskas, F. Claeyssens, Synthesis, characterization and 3D micro-structuring via 2-photon polymerization of poly(glycerol sebacate)-methacrylate-an elastomeric degradable polymer. Frontiers in Physics. 2018 6, 41.
- N. Farr, S. Pashneh-Tala, N. Stehling, N. Green, F. Claeyssens, C. Rodenburg. Characterizing Cross-Linking Within Polymeric Biomaterials in the SEM by Secondary Electron Hyperspectral Imaging. Macromolecular Rapid Communications 2019, 41.3