Spatial and spectral dynamics in STEM hyperspectral imaging using random scan patterns
- Abstract number
- 1398
- Event
- European Microscopy Congress 2020
- DOI
- 10.22443/rms.emc2020.1398
- Corresponding Email
- [email protected]
- Session
- DHA.3 - Machine assisted acquisition and analysis of microscopy data
- Authors
- Alberto Zobelli (1), Steffi Woo (1), Anna Tararan (1), Luiz H.G. Tizei (1), Nathalie Brun (1), Xiaoyan Li (1), Odile Stéphan (1), Mathieu Kociak (1), Marcel Tencé (1)
- Affiliations
-
1. Laboratoire de Physique des Solides, Université Paris Saclay
- Keywords
Scanning transmission electron microscopy
Scan control
Sparse imaging
EELS
Cathodoluminescence
- Abstract text
The use of unconventional scan pathways is a promising route currently explored to improve acquisition speed, reduce electron dose [1] and, in certain cases, to avoid distortions associated with scan and sample instabilities [2]. Furthermore, in the last years, subsampling has been extensively discussed as a very effective strategy for dose-reduced image acquisition. Indeed, scanning transmission electron microscopy (STEM) images are often associated with a certain degree of over-redundancy, and a good approximation of the full image can already be obtained from an appropriate subset of pixels. The subsequent application of image reconstruction techniques can permit to fill the missing data within the image matrix [3,4].
In this work, we present an original implementation of an effective random scan acquisition mode in STEM obtained directly using the scanning control unit [5]. The setup permits an extended control of the scanning parameters and therefore offers a large flexibility on the acquired image data structure. The complete image matrix is filled in a fully randomized fashion, each pixel being stamped with its acquisition time. A series of subsampled random sparse images can then be extracted at successive time frames and inpainting image reconstruction applied. This method allows to decouple the space and time information and to monitor the sample and spectral signals dynamics; it can be very generally employed in hyperspectral imaging with the sole limitation of longer probe displacements with respect to a standard raster scan. The potential interest of the random scan operating mode arises in the spectroscopy of systems sensitive to electron irradiation, and in monitoring the spectral signal and image dynamics. Here we present some proofs of concept of the flexibility of the random scan method illustrating its applications in different spectro-microscopy contexts: electron energy loss spectroscopy (EELS) mapping and nano-cathodoluminescence (CL) spectrum images.
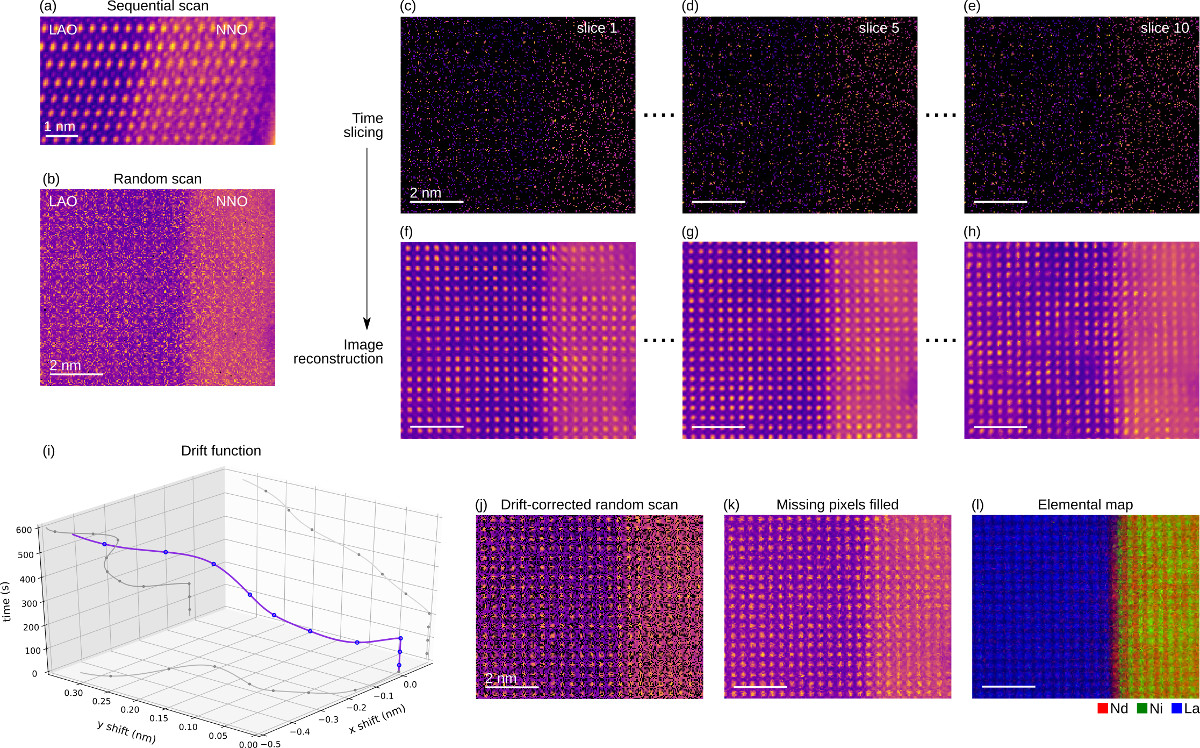
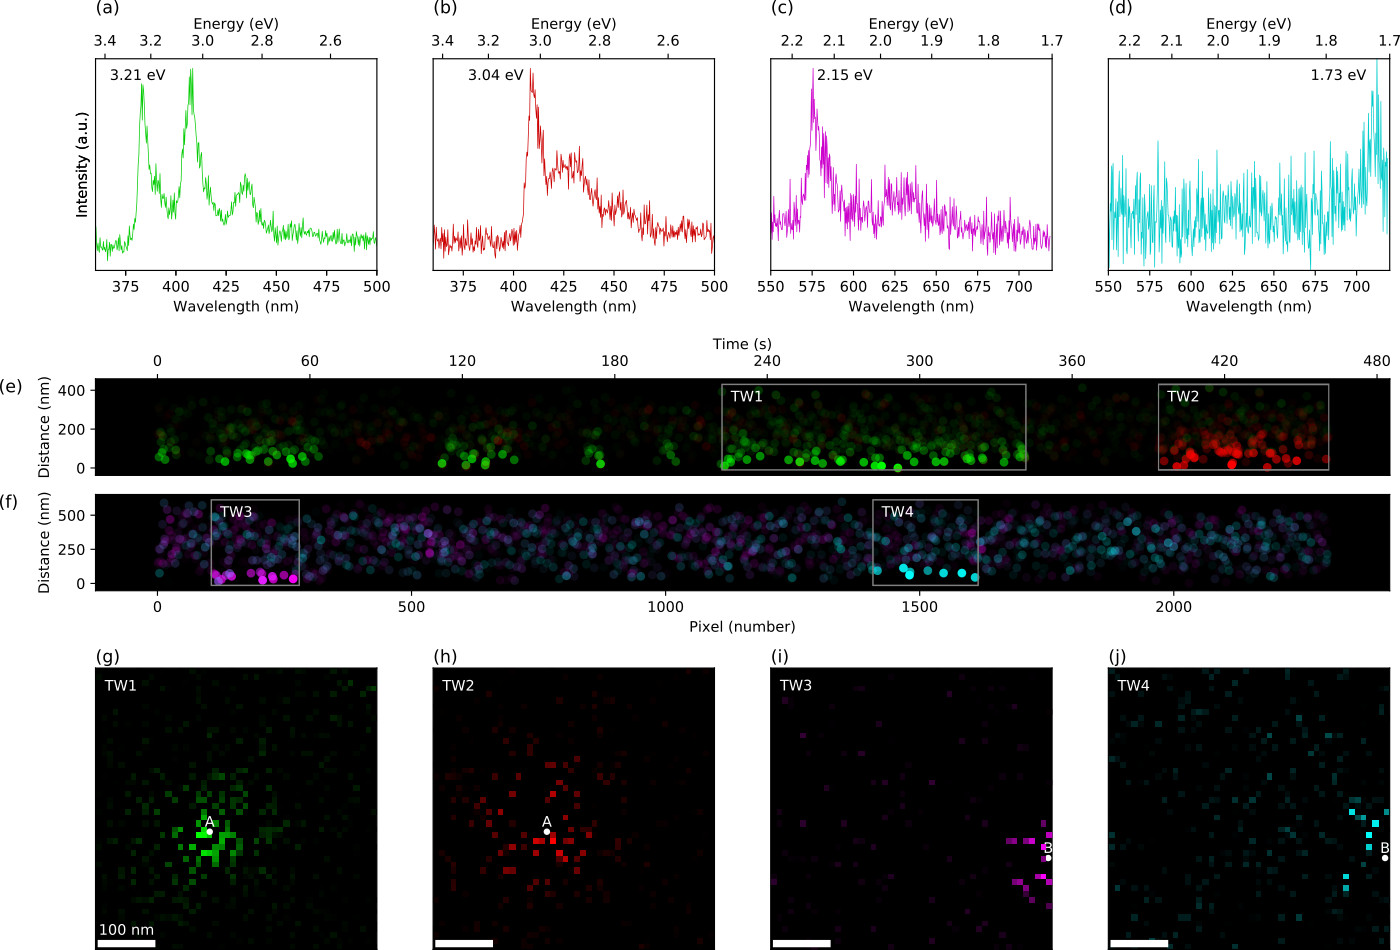
Specimen drifts are very often encountered in STEM imply that, although the imaging system is capable of a very high spatial resolution, the utmost performance cannot be reached: individual atomic columns can be visualized but image distortions hinder any precise quantitative measurement. Ultimate imaging capabilities can be recovered by combining the random scan acquisition mode with a post-treatment work-flow designed to segment, cross-correlate, and realign sparse image stacks (Fig.1). In hyperspectral imaging, the observation of the temporal evolution of a spectroscopic signal with a spatial resolution is precluded by the intrinsic coupling of the space and time coordinates given the conventional sequential scanning. However, time-dependent changes can be considerably recovered by operating in the random scan mode. Indeed time-resolved spectroscopic maps can be extracted by time-slicing the complete hyperspectral image (Fig. 2).
Figure 1. STEM-HAADF image of the NdNiO 3 –LaAlO 3 (NNO–LAO) interface acquired (a) in the standard sequential raster scan mode and (b) in the random scan mode. (c–e) Time slices derived from the random scan image, and (f–h) corresponding images reconstructed using the BPFA method. (i) Drift function as derived from the reconstructed image stack. (j) Drift-corrected random-scan HAADF image, and (k) the same image where missing pixels have been filled. (l) Atomically-resolved elemental maps obtained from the core-loss EELS hysperspectral image acquired simultaneously with the random-scan HAADF image.
Figure 2. Space and time dependence of various CL signals in a few-layer h-BN flake obtained from a random-scan hyperspectral image, illustrating the blinking and spectral diffusion of individual emission spots. (a–d) Characteristic CL spectral features observed in the hyperspectral image. (e,f) Time evolution of the emission lines as a function of the pixel acquisition time and pixel distance from the center of the emission origin. (g–j) Intensity maps extracted for the characteristic signals in (a–d) within the time windows (TW) indicated in panels (e,f). Points A and B indicate the reference positions used for the graphs in panels (e,f).
- References
[1] A. Stevens et al., Appl. Phys. Lett. 112, 43104 (2018)
[2] X.Sang et al. Sci. Rep. 7, 43585 (2017)
[3] A.Stevens et al. Microscopy 63, 41 (2014)
[4] P. Trampert et al. Ultramicroscopy 191, 11 (2018)
[5] A Zobelli et al., Ultramicroscopy 112912 (2020)
[6] The authors acknowledge funding from the ANR, program of future investment TEMPOS-CHROMATEM (No. ANR-10-EQPX- 50). SYW acknowledges NSERC for the fellowship funding.