Stress induced martensitic transformation in Ni-Ti observed by in-situ tensile straining in TEM
- Abstract number
- 344
- Event
- European Microscopy Congress 2020
- DOI
- 10.22443/rms.emc2020.344
- Corresponding Email
- [email protected]
- Session
- PSA.2 - Metals & Alloys
- Authors
- Dr. Saeid Pourbabak (2, 1), Dr. Andrey Orekhov (2), Dr. Vahid Samaee (2), Prof. Dr. Bert Verlinden (1), Prof. Dr. Jan Van Humbeeck (1), Prof. Dr. Dominique Schryvers (2)
- Affiliations
-
1. Catholique University of Leuven
2. University of Antwerp
- Keywords
in-situ, martensite, Ni-Ti, PTP, tensile straining
- Abstract text
Nano-mechanical in-situ TEM tensile straining was used to study the stress induced martensitic transformation in Ni50.8Ti49.2 obtained from a 46.3% cold drawn microwire with 150mm diameter and annealed at 600°C for 20min or 800°C for 30min, followed by room temperature quenching, yielding grains up to ~1μm and ~30μm size, respectively. Dog-bone shaped specimens with lateral sizes of ~ 0.7-1.5´2-3μm were cut from the wires using Ga+ FIB yielding some single and some polycrystal specimens. The specimens were mounted on a Bruker MEMS push-to-pull (PTP) device in a PI95 PicoIndenter holder and investigated in a FEI Osiris microscope running at 200kV. Before the mechanical test, the specimen thickness was measured by EELS. The in-situ experiments were carried out in the displacement control mode with a 0.2-0.3nm/s displacement rate yielding a strain rate of about 10-4/s. The real displacement of the specimens was obtained by image displacement tracking of the deformation movies and accordingly strain amounts were obtained by dividing the raw displacement data by the initial length of the specimen [2]. Knowing the device spring constant, the force on the specimen can be calculated thus yielding the stress by dividing by the specimen cross-section.
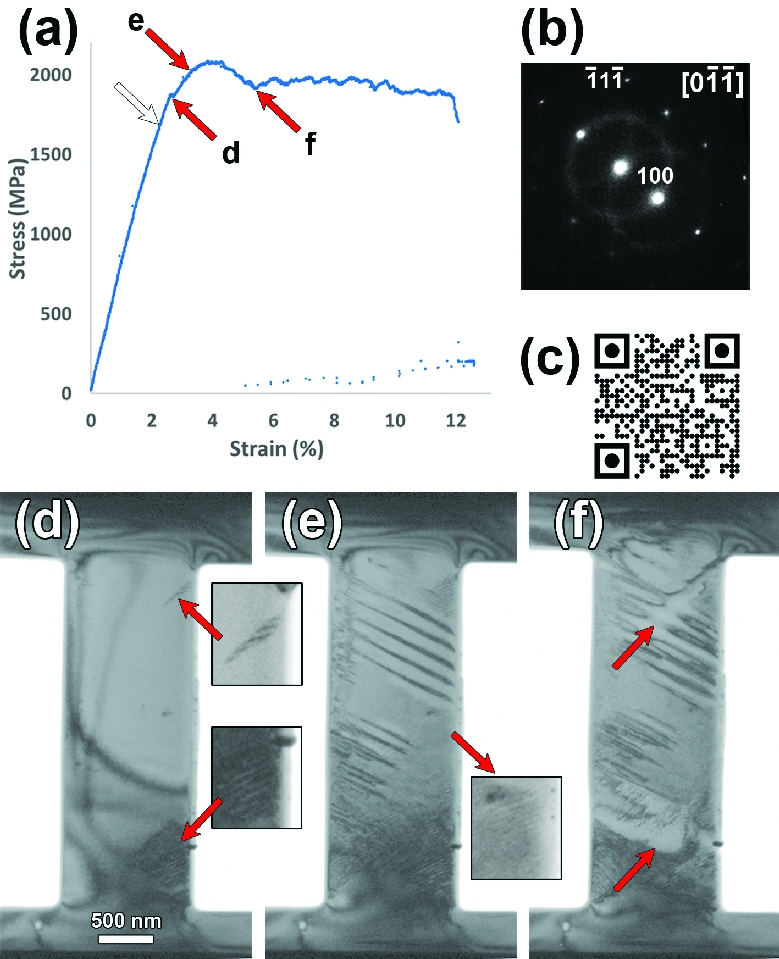
Figure 1(a) represents the in-situ stress-strain curve of a 105±11nm thick single crystal specimen with normal close to [011]B2. The pulling direction is close to [-11-1]B2 (Figure 1(b)). Halfway the region of sharp increase of stress versus strain, at appr. 1.8% strain, the slope of the curve slightly decreases and the remaining stress increases up to above 2GPa which is followed by a stress drop, similar as in bulk material. From the corresponding TEM video (QR-code in Figure 1(c)), the first visible signs of the martensitic transformation occur at ~ 2.2% strain (white arrow in Figure 1(a)), with the appearance of a dark region on the bottom–right side with internal plate–like contrast. Next a single needle appears in the top–right corner in Figure 1(d), corresponding to point d on the curve, which is at the end of the elastic regime. The needle reveals typical twin variant black/white contrast surrounded by interface contrast separating the plate from the austenite matrix, as seen in the zoom. Upon increasing the strain, more dark parallel plates again clearly resembling a martensite micro–structure nucleate and grow in different regions of the specimen (Figure 1(e)), some now showing a different variant orientation from those nucleated before as judged from the direction of the plates and interfaces. By further pulling the specimen, the contrast of several martensite plates changes and neighboring plates coalesces, from which an intermediate stage is shown in Figure 1(f), and plastic deformation occurs within the already existing martensite by (de)twinning and/or dislocation slip.
Figure 1 (a) Stress–strain curve of the PTP single crystal specimen, (b) SAED pattern of the specimen revealing a close to [-11-1]B2 pulling direction, (c) QR code of the corresponding experiment video, (d) – (f) different stages of the tensile test obtained as snapshots from the video and corresponding to the points indicated on the stress–strain curve of (a).
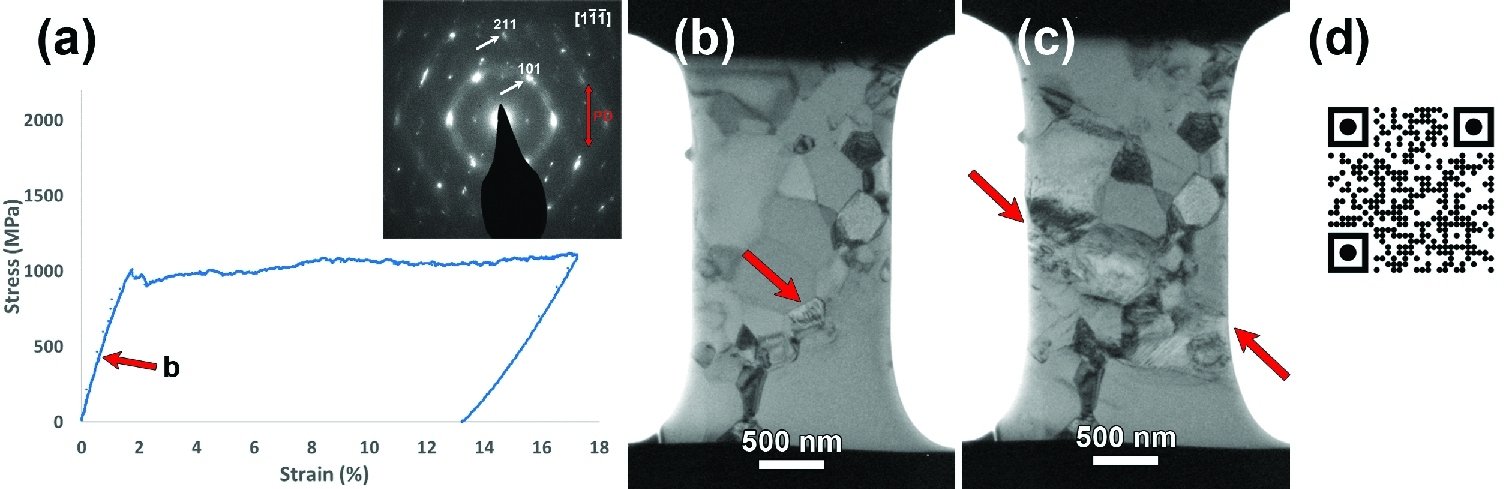
Figure 2(a) represents the in-situ stress-strain curve of a polycrystal specimen of 220±22nm thickness. This specimen has a 〈111〉B2 texture and an average 〈211〉B2 pulling direction, as concluded from the overall SAED pattern in the inset. The first transformation occurred at 0.6% strain in a 300nm diameter grain, as shown in Figure 2(b) and the accompanying video from Figure 2(d), which is clearly not the largest grain in the view. The austenite was elastically deformed up to ~ 1.5% strain where the stress plateau with a small stress drop in the beginning started. At this point a sharp martensite plate appeared on the top–left side of the specimen, quickly followed by an inclined and localized deformation band in the center of the specimen, as indicated by arrows in Figure 2(c). The latter propagated sideways towards upper and lower parts of the specimen and while some extra martensite plates appeared in adjacent grains, the deformation in this band continued to increase, suggesting a Lüders-band like behavior. The transformation continued up to 17.2% deformation, where the pulling was stopped and the specimen was released.
Figure 2 (a) Stress–strain curve of a polycrystal specimen, with corresponding SAED as inset. (b) The first transformation occurring in the indicated grain. (c) Lüders–like band indicated by arrows forms upon the stress drop in the beginning of the plateau. (d) QR code of the video.
In all samples, the measured Young’s modulus of the austenite phase is around 70GPa, considerably higher than the averaged 55GPa of the original microwire sample. The height of the superelastic stress plateau shows an inverse relationship with the specimen thickness, even when including the bulk measures.
- References
[1] V Samaeeaghmiyoni, H Idrissi, J Groten, R Schwaiger and D Schryvers, Micron 94 (2017), p. 66.