Study of calcium phosphate formation driven by the dissolution of a 45S5 bioactive glass
- Abstract number
- 443
- Event
- European Microscopy Congress 2020
- DOI
- 10.22443/rms.emc2020.443
- Corresponding Email
- [email protected]
- Session
- PST.6 - In-situ and in-operando microscopy
- Authors
- Mr Elkin Lopez-Fontal (2), Dr Richard Langford (1)
- Affiliations
-
1. Academic
2. Research Student
- Keywords
Calcium Phosphate, 45S5 Bioactive glass, Liquid phase TEM, dissolution, nucleation
- Abstract text
A liquid-phase transmission electron microscopy cell is being used to study the dissolution of bioactive glass and the resulting formation of hydroxyapatite (HA) like material.1-3 Silicate based bioactive glasses, form hydroxyapatite like material interfacial bonding between human tissue and elements such as implants, bone grafts, fillings.4-5 When in contact with an aqueous solution, the release of the bioglass modifying ions and the hydrolysis/condensation of the Si02 network drives calcium phosphate (CaP) precipitation and nucleation. The in-situ real-time imaging of this process is being used to study (i) the role of the hydrolysed/condensed silica-gel layer formed on/around bioglass particles in the CaP formation, (ii) if there are any incorporated ions i.e. sodium, silicon from the bioglass dissolution into the calcium phosphate formed material, (iii) whether this process proceeds by classical or non-classical nucleation steps and (iv) if phase transitions occur can these be observed in real-time.
The 45S5 bioactive glass, which was initially 25 µm particle size was ball-milled to 400±200 nm in size so to fit into the environmental cell. Sonicated ball-milled bioglass in IPA was micro-sprayed onto a top-heater chip to give a uniform particle distribution and a controllable areal density. A mask was used to control spray the glass only over the membrane area. A phosphate solution ((NH4)2HPO4, 10 mM) pH ~ 8 flowed through the LC. Experiments were conducted at 37 and 21 oC and two different chips substrates were used, plasma cleaned and chemically functionalised (CF) chips. In addition, ex-situ experiments were performed to help understand the impact of the electron beam radiation on the process and the impact of the confined geometry.
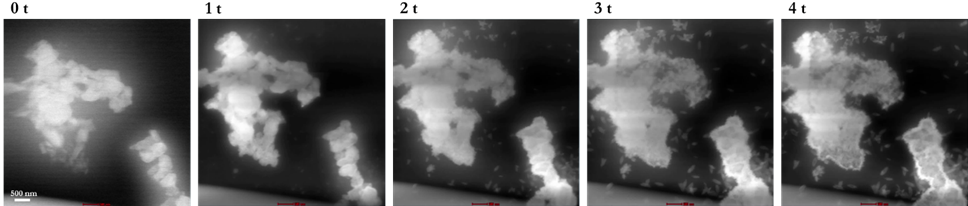
Figure 1 shows stills from the movie of the bioglass undergoing dissolution and the formation of material around and near to the glass. The bioglass can be seen to undergo dissolution from the increasing formed layer inwards. Also, the material can be seen to similarly be nucleating away from the bioglass.
In these experiments, a buffered solution was used to negate the radiolysis products from etching the CaP material being formed. The type of chip used, whether chemically functionalised or oxygen plasma cleaned chips, the imaging strategy used (i.e. continuous imaging or blanking between imaging) and the temperature of the experiments resulted in differences in the fluid volume in the liquid cell gap on imaging, the morphology and chemical composition of the material formed. For the chemically treated chips, the fluid would move away during imaging resulting in a decrease in fluid thickness. This enabled higher resolution imaging. This may be partly attributed to differences in the interface charge on the surfaces of these chips on imaging relative to the oxygen plasma-treated chips.
Figure 1: STEM time-series images of the in-situ reaction between 45S5 bioactive glass particles and an aqueous phosphate solution at 21°C when using chemically functionalised chips and blanking the e-beam.
When blanking the e-beam for periods of time and using the CF chips at 21oC a ribbon-like morphology formed which had a Ca/P ratio close to 1. Whereas, a Ca/P ratio of about 1.6 and a spiky morphology resulted when using plasma cleaned chips at 37oC. These differences on the nucleation and resulting chemistry can partly be attributed to differences in the relative ion concentrations released from the glass with time and in the solution phase analysis also showed the presence of secondary ions such as Na and Si within the formed materials.
Often in the experiments, large volumes of solution could wash across the region being imaged effectively preventing imaging. EELS measurements indicated that the solution thickness was of the order of 50-200 nm, and it may suddenly increase at a point where no measurement was possible. Experiments varying the flow rates, looking at pushing and pulling the solution, using different surface treatments to try and prevent this occurring or to give some control in reducing the thickness once it occurred were performed. Unfortunately, these had little impact on controlling the fluid thickness. Experiments using nanosized gold particles have shown that as soon as the cell is filled with certain fluid is difficult to be exchanged by a fresh one as the design of the liquid cell does not force the pumped fluid to go through the nanogap’s cell and fresh fluid did not always displace the already fluid in the cell. This observation is important as indicates that the ion concentrations released from the glass can be those of static condition as against the expected fluid flow replenishing condition.
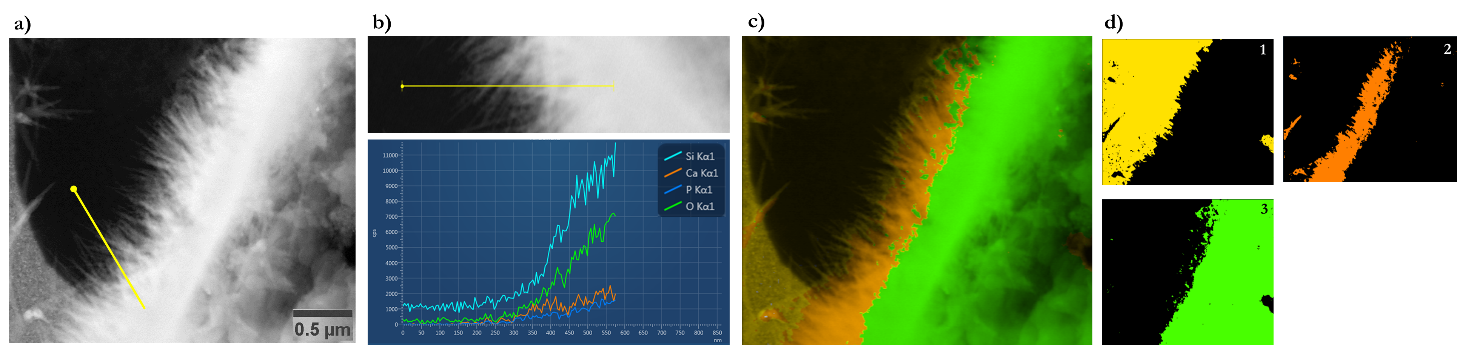
The experimental data indicate that silica hydrolysis/condensation due to its acidic character could be a key part in the formation of CaP (Figure 2). In many experiments’ silica could be seen to condense away from the bioglass and then Ca/P material was seen to nucleate on this. The silica could act as calcium ions concentrator owing to a case of ion binding6 ( due to attracting forces between diffusing Ca cations and a silica gel anionic media) that with the PO4 ions from the bulk solution and/or the bioglass enable for CaP supersaturation to happen and therefore CaP precipitation, nucleation and subsequent crystallization.7-14
Figure 2: post-EDS analysis of the in-situ reaction between ball-milled 45S5 bioactive glass and an aqueous phosphate solution at 37oC performed on individual chips when the LC has been dismantled. a) the STEM image where EDS elemental analysis is performed. b) a single EDS line-scan showing the elements present on it (from the line showed in a)). c) and d) correspond to the segmented STEM images showing an elemental mapping of three distinct sectors i.e. the background Si:N rich area (1), Ca:P rich sector (2), and Si:O rich sector (3).
Although, experiments using the liquid cell are difficult as they involved many parameters that are not fully under control i.e. radiolysis, cell wettability, signal-to-noise interplay, material sensitivity to the e-beam, liquid cell assembly. These observations have provided insights that enable a better understanding of the used material system and the LP-TEM modus operandi.
- References
1. Hench, L. L. Journal of the American Ceramic Society. 1998.
2. de Jonge, N.; Ross, F. M. Nature nanotechnology. 2011.
3. Wang, L.; Nancollas, G. H. Chemical reviews. 2008.
4. Mann, S., 2001.
5. Jones, J. R. Acta Biomater. 2015.
6. Smeets, P. J., et al. Nature materials. 2015.
7. Cao, W. P.; Hench, L. L. Ceramics International. 1996.
8. Hench, L. L. Journal of Materials Science-Materials in Medicine. 2006.
9. Ohtsuki, C., et al. Journal of Non-Crystalline Solids. 1992.
10. Habraken, W. J., et al. Nature communications. 2013.
11. Smeets, P. J. M., et al. PNAS. 2017.
12. De Yoreo, J. J. Reviews in Mineralogy and Geochemistry. 2003.
13. De Yoreo, J. J., et al. Science. 2015.
14. Wang, X., et al. Communications Chemistry. 2018.