Ultrastructural characterisation of compensated hypertrophic murine hearts in response to pressure overload
- Abstract number
- 367
- Event
- European Microscopy Congress 2020
- DOI
- 10.22443/rms.emc2020.367
- Corresponding Email
- [email protected]
- Session
- LSA.7 - Pathology, immunocytochemistry and biomolecular labelling
- Authors
- Dr. Mara Camelia Rusu (2, 1), Dr. Tomokazu Murakawa (2), Dr. Javier Moncayo-Arlandi (2), Prof. Roland A. Fleck (1), Prof. Kinya Otsu (2)
- Affiliations
-
1. Centre for Ultrastructural Imaging, King’s College London
2. Faculty of Life Sciences and Medicine, King’s College London
- Keywords
cardiac hypertrophy, mitochondria dynamics, transmission electron microscopy, electron tomography
- Abstract text
Summary
We attempted to characterise the acute cardiac remodelling response of murine hearts to pressure overload. Our aim is to integrate physiological and molecular data with ultrastructural data. We quantitively evaluate mitochondrial networks in cardiomyocytes using 2D and 3D electron microscopy techniques.
Introduction
Heart failure is a leading cause of morbidity and mortality in industrialised countries. Progress is being made towards improving health outcomes of patients by the introduction of evidence-based therapeutics and patient management systems. These advances are fuelled by the fundamental understanding of molecular mechanisms of cardiac disease.
Heart failure is characterised by the inability of the heart to pump enough blood to meet the organism requirements. In mouse pressure overload models, heart failure is preceded by cardiac hypertrophy. If the pressure overload ceases the heart can undergo reverse remodelling, however if the stressor persists compensated cardiac hypertrophy will progress to decompensated heart failure [1].
Mitochondrial dysfunction has been implicated in many chronic diseases including heart failure. A number of gaps in our knowledge regarding mitochondria function have been identified, such as the mechanisms by which mitochondria dynamics are regulated [2]. Cardiac hypertrophy is characterised by an imbalance between the energetic requirements of the cells and the ability of the mitochondria to generate the required ATP.
Mitochondria are multifunctional organelles that form a dynamic network that is maintained through fission, fusion and mitochondria-specific autophagy, mitophagy. These organelles are involved in ATP generation, calcium dynamics, as well as in energy distribution [3]. It was shown that in striated muscle cells mitochondria form specialised networks which differ between glycolytic, oxidative and cardiac muscle cells. Cardiomyocyte mitochondria occupy 30% of the cell cytoplasm and form parallel networks to the contraction axis. They are highly interconnected by intermitochondrial junctions [3]. Previous reports have demonstrated that mitochondrial fission is required for cardiomyocyte hypertrophy in vitro [5].
Currently a detailed quantitative evaluation of mitochondria morphology and connectivity in early and late compensated hypertrophy using electron microscopy has not been carried out. A better understanding of compensated cardiac hypertrophy is necessary to understand the factors that contribute to the transition of this stage to decompensated heart failure.
Methods
C57BL/6 mice were subjected to pressure overload by means of transverse aortic constriction (TAC) and Sham surgeries. The mice were followed using echocardiography to monitor the development of cardiac dysfunction. Samples were collected 5 days and 4 weeks after surgery (3 animals/group). Histological analysis was performed to quantify collagen deposition, inflammatory cell infiltration and cardiomyocyte hypertrophy. qPCR and Western blotting were used to estimate mRNA and protein levels. Mitochondria function was measured using Seahorse XF.
For electron microscopy hearts were perfused fixed in situ. The left ventricular free wall was processed for transmission electron microscopy. Micrographs and tilt series were collected using a JEOL 1400 Plus and a JEOL JEM-F200 STEM.
Measurements of morphological parameters were carried out using Fiji and frequency distributions were statistically analysed using the Mann-Whitney test.
Results
Echocardiography shows that mice subjected to TAC surgery exhibit signs of compensated hypertrophy 5 days after TAC, as demonstrated by the preservation of left ventricular fractional shortening. Hypertrophy was detected by the significant increase of the interventricular septum and of the left ventricular posterior wall thickness when compared to Sham-operated mice. These physiological parameters are maintained 4 weeks after surgery, suggesting that our TAC model of milder pressure overload is suitable to detect gradual changes in heart function before transitions from hypertrophy to heart failure.
Mitochondria function was assessed and an increase in basal respiration was detected 5 days after surgery. This is due to the increase in the energetic demands of the cell.
No significant differences in the protein levels of mitochondria fusion/fission proteins were found, with the exception of Parkin which was significantly increased in TAC hearts 5 days and 4 weeks after surgery. Four weeks after surgery we have also detected a significant decrease in Mitofusin2 levels in TAC-operated animals when compared to Sham-operated group.
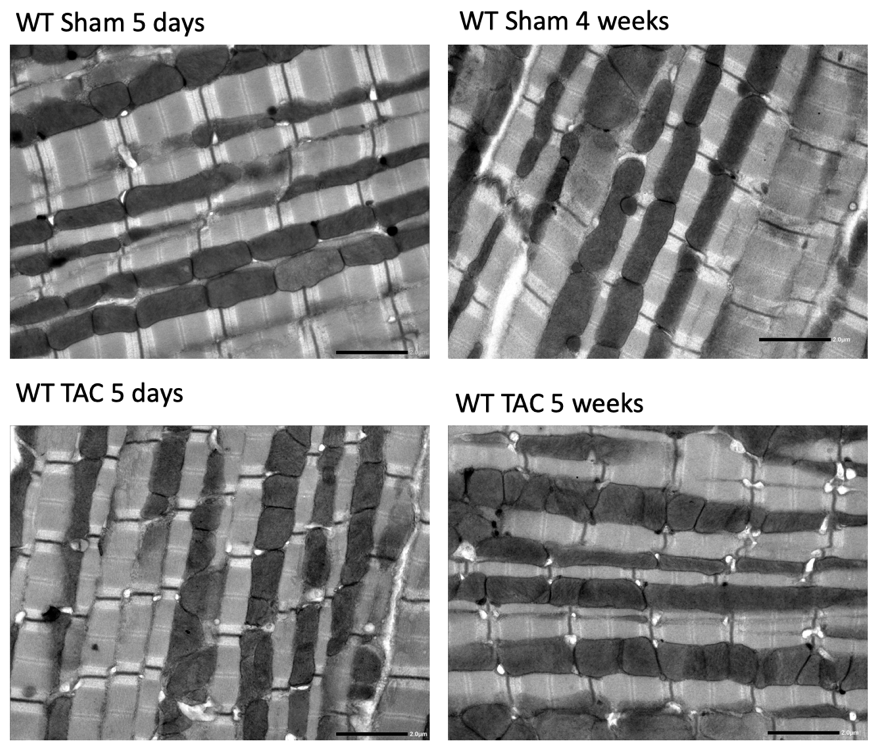
Electron microscopy was employed to investigate mitochondria ultrastructure as well as characteristics of the mitochondria network (Figure 1). No obvious ultrastructural differences in mitochondria between Sham and TAC-operated mice were observed. In order to obtain an overview of the tissue we have collected large scale montages at medium magnification (6000x-8000x). Using montages, we have assessed the arrangement of intermyofibrillar mitochondria, which is preserved in TAC animals. This has also allowed to pinpoint structures of interest (e.g. mitophagosome) in order to carry out electron tomography at a higher magnification.
Figure 1. Electron micrographs of murine myocardium following Sham and TAC at 5 days and 4 weeks after surgery showing myofibrils and intermyofibrilar mitochondria. Scale bar represents 2 μm.
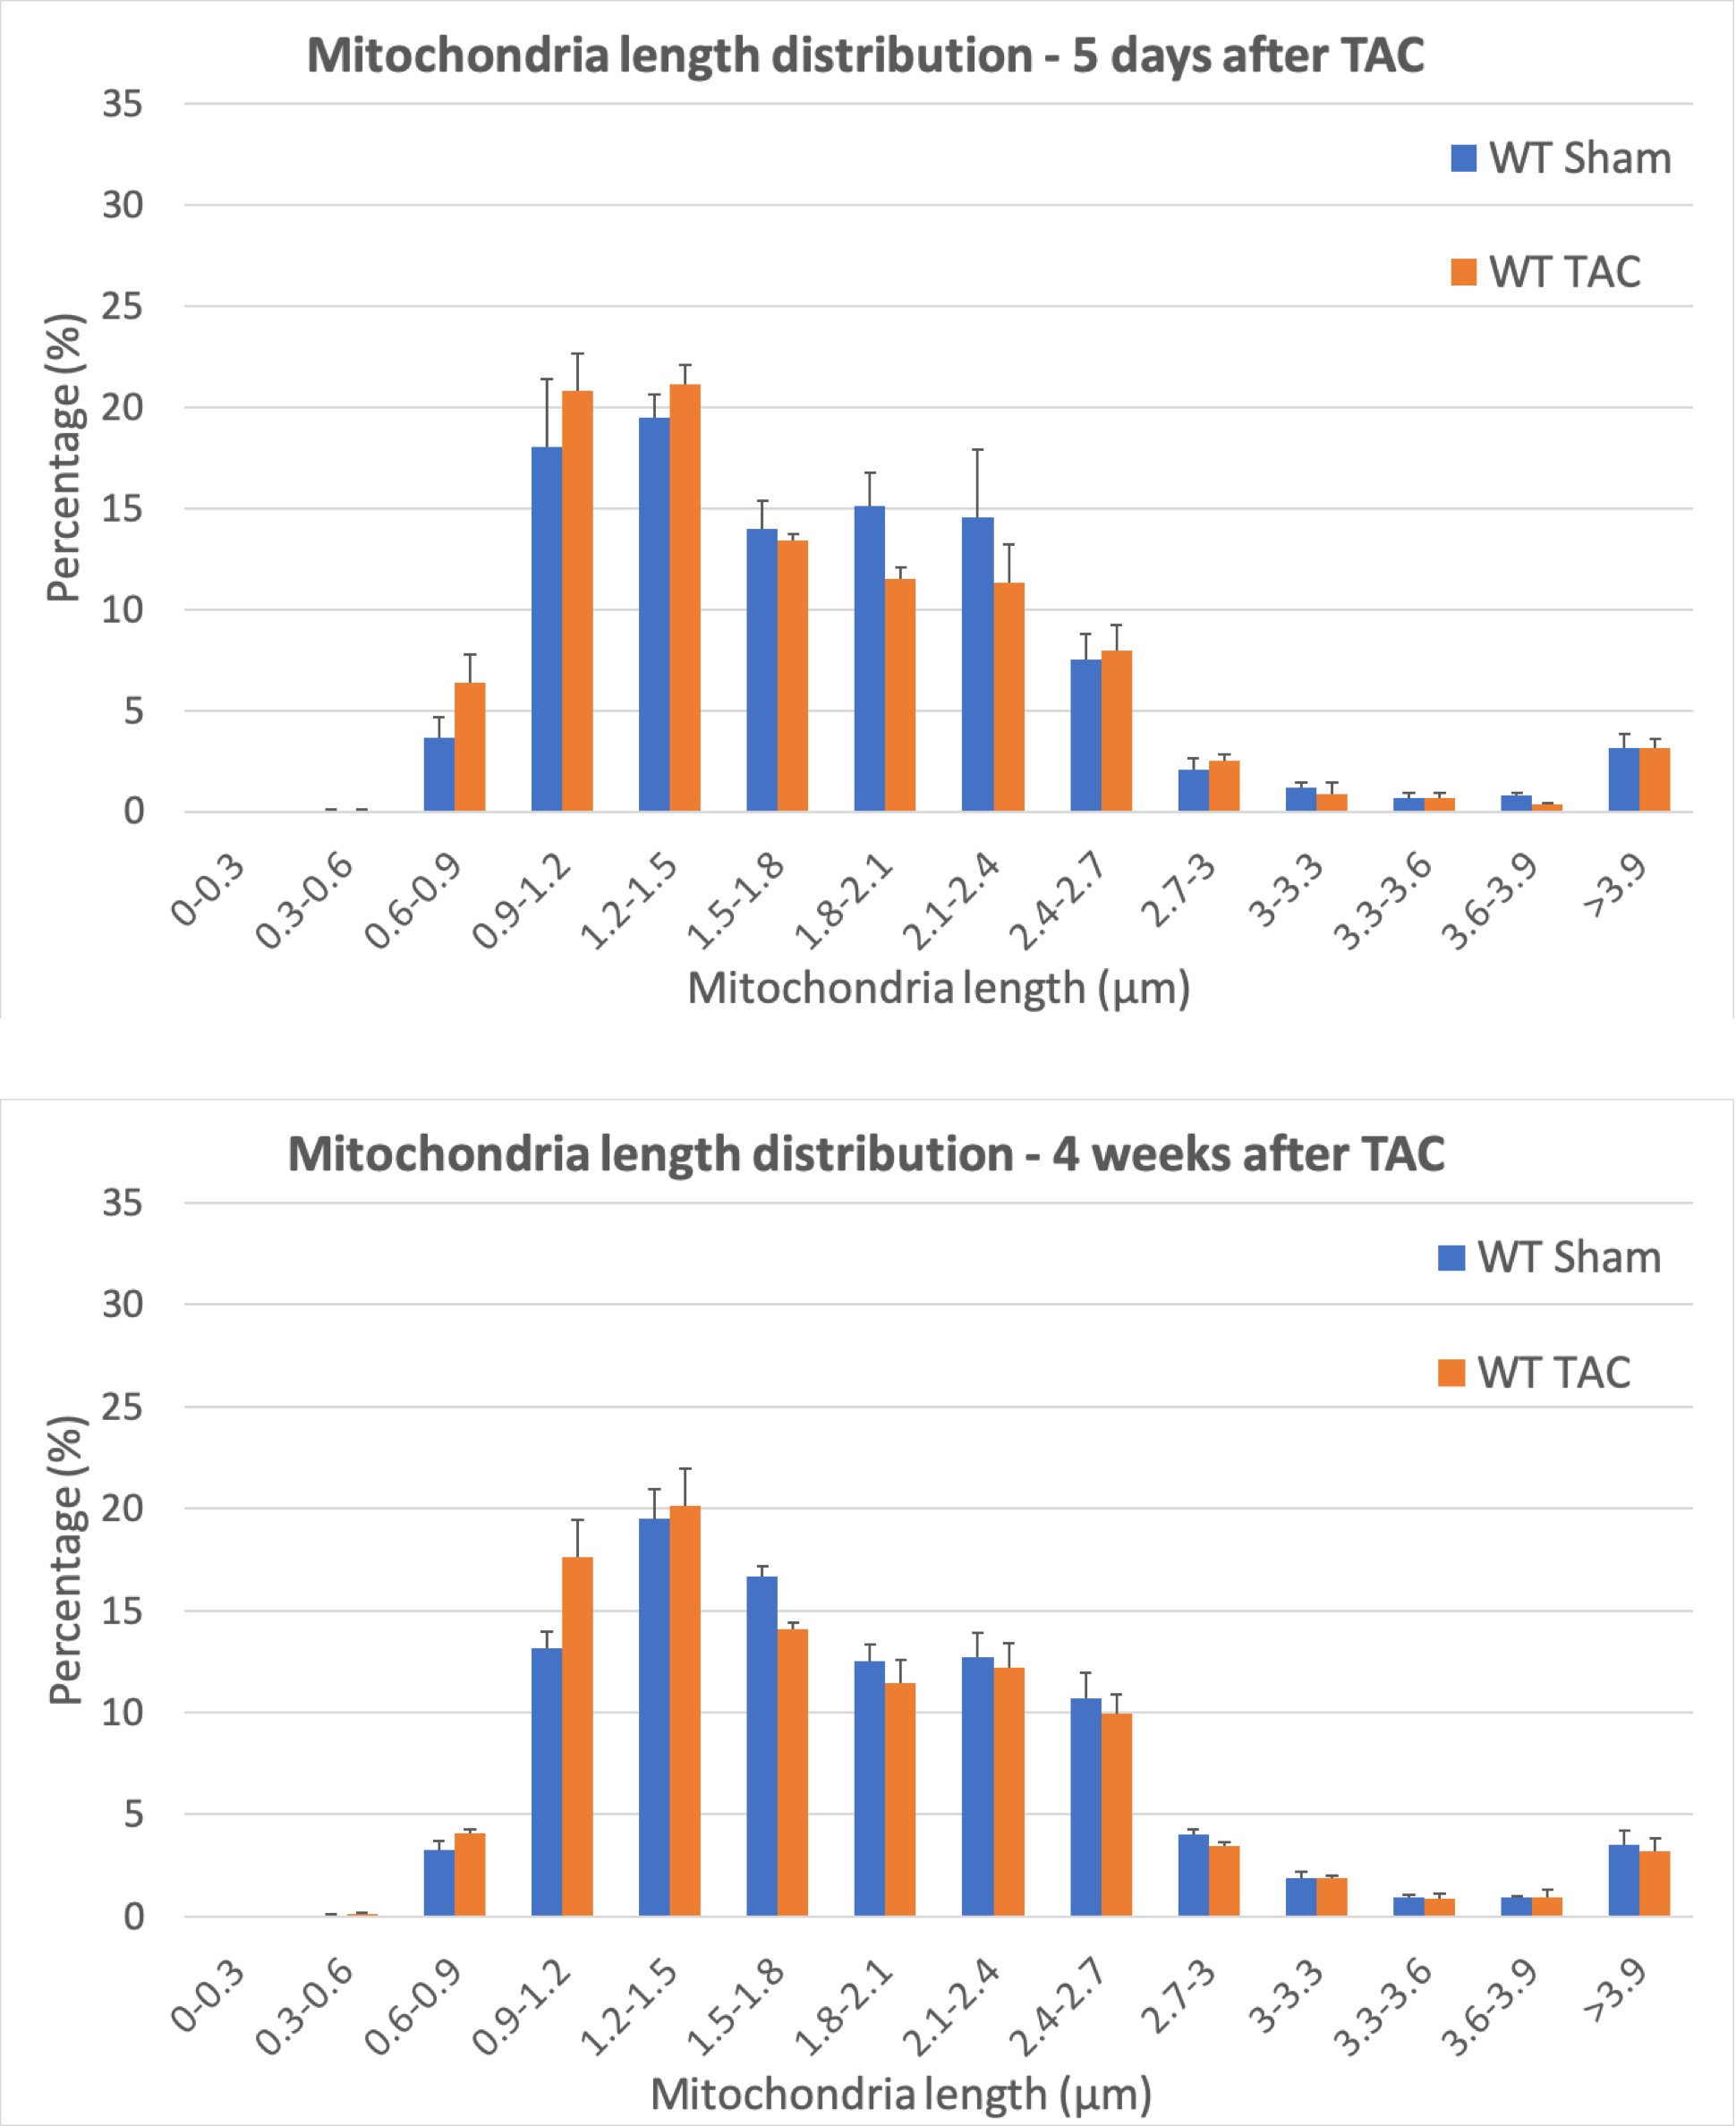
Frequency distribution of mitochondrial morphological parameters was analysed in order to understand how mitochondrial dynamics might be affected by pressure overload. In early pressure overload we have seen that the percentage of smaller and shorter mitochondria is significantly increased in TAC-operated animals compared to Sham (Figure 2). This suggests that the mitochondria are undergoing fragmentation and biogenesis in order to keep up with the increased energy demand of the cell. This response is maintained 4 weeks after TAC, however significant changes were only detected in the frequency distribution of length.
Figure 2. Frequency distribution of mitochondria length 5 days and 4 weeks after surgery shows a significant increase of shorter mitochondria following pressure overload.
Electron tomography of mitochondria has been performed to validate the measurements carried out in 2D. In the sections used for quantification mitochondria that appear separate in 2D are connected via inter-mitochondrial junctions and can therefore be considered individual mitochondria.
Conclusion and future plans
Compensated cardiac hypertrophy is a physiological response to increased ventricular wall stress. We have shown that compensated cardiac hypertrophy is detected 5 days after transverse aortic constriction using echocardiography. The mitochondrial network of the cardiomyocytes responds to the increased energy requirements by undergoing fragmentation. We are currently working on a quantitative 3D approach to assess the inter-mitochondrial junctions. We are also planning on evaluating mice that genetically lack a pro-fission protein [6].
- References
- Nishida, K. & Otsu, K. Autophagy during cardiac remodeling. J. Mol. Cell. Cardiol. 95, 11–18 (2015).
- Murphy, E. et al. Mitochondrial Function, Biology, and Role in Disease: A Scientific Statement from the American Heart Association. Circulation Research 118, (2016).
- Glancy, B. et al. Mitochondrial reticulum for cellular energy distribution in muscle (2015).
- Bleck, C. K. E., Kim, Y., Willingham, T. B. & Glancy, B. Subcellular connectomic analyses of energy networks in striated muscle. Nat. Commun. 9, 1–11 (2018).
- Pennanen, C. et al. Mitochondrial fission is required for cardiomyocyte hypertrophy mediated by a Ca2+-calcineurin signalling pathway. J. Cell Sci. 127, 2659–2671 (2014).
- The authors gratefully acknowledge funding from the European Research Council under grant number 692659.