Visualizing GFP by EM – a CLEM approach with nanobodies for GFP-specific-APEX2 DAB oxidation
- Abstract number
- 555
- Event
- European Microscopy Congress 2020
- DOI
- 10.22443/rms.emc2020.555
- Corresponding Email
- [email protected]
- Session
- LST.5 - Correlative Microscopy across the scales
- Authors
- Charlotte Hamngren Blomqvist (3), Saskia Lippens (2), Sebastian Munck (1), Tommy Nilsson (4), Julia Fernandez-Rodriguez (3)
- Affiliations
-
1. BioImaging Core and VIB-KULeuven Center for Brain and Disease Research, University of Leuven
2. BioImaging Core and VIB-Ugent Center for Inflammation Research, VIB
3. Centre for Cellular Imaging, University of Gothenburg
4. Department of Medicine, McGill University
- Keywords
APEX2, ArfGAP1, CLEM, DAB oxidation, nanobodies, protein visualization
- Abstract text
In this study, we demonstrate a correlative light and electron microscopy (CLEM) approach for ultrastructure visualization of proteins in electron microscopy. In an inducible system for controlled overexpression of a cytosolic protein fused with GFP, the cells were transiently transfected to express a complex compounded by an anti-GFP nanobody, APEX2[1], and mCherry. Subsequent DAB oxidation then provided specific contrast at the location of the protein of interest, making EM studies of the protein location at a high resolution possible. We have utilized this approach for locating the Golgi associated cytosolic protein ArfGAP1 as a function of oleic acid (OA) treatment, which triggers translocation of the ArfGAP1 to the membrane of the newly formed lipid droplets (LDs).
For a long time, in-situ visualization of proteins was only possible using fluorescence microscopy (FLM), with a maximum resolution of 200 nm. In transmission electron microscopy (TEM), protein visualization has traditionally been done with IgG immunolabeling, resulting in low spatial precision since antibody-gold-particle complexes are approximately 28 nm. A way to visualize proteins for TEM with a higher spatial resolution (<10 nm), is to genetically fuse a nanobody, targeting green fluorescent protein (GFP) coupled to a protein of interest, with the ascorbate peroxidase 2 (APEX2). The fixed cells are treated with 3,3′-Diaminobenzidine (DAB) and H2O2. In the presence of APEX2 and oxidized by H2O2, DAB forms an insoluble polymer localized at the protein of interest. For studying the translocation of the cytosolic membrane-associated protein ArfGAP1, we are using a similar approach for CLEM analysis of protein visualization as demonstrated for membrane-bound proteins by de Beer et al.[2].
ArfGAP1 is a cytosolic protein commonly localized close to the Golgi membrane, but it is also found around LDs after OA treatment[3]. Our objective is to image the localization of ArfGAP1 in TEM, using an anti-GFP nanobody tagged with APEX2 and mCherry with DAB oxidation in an inducible Hek293 cell system. The aims of our study are i) to show the location of the ArfGAP1 in relation to forming COPI vesicles on the Golgi apparatus, which is not possible using FLM since COPI vesicles are usually less than 70 nm in diameter, ii) to specifically determine the location of ArfGAP1 in Hek293 cells as it translocates to the LD membranes a function of time after OA treatment, and iii) to demonstrate the potential of CLEM together with an anti-GFP nanobody complex including the peroxidase APEX2 and the fluorescent reporter protein mCherry, also for an overexpressed cytosolic protein. Targeting GFP with the nanobody takes direct advantage of the fact that GFP is already one of the most used fluorescent reporter proteins. However, the approach of using a nanobody to facilitate APEX2 localization to a protein of interest is more general, and not only applicable to specific targets.
We used T-Rex inducible Hek293 cells, which overexpress ArfGAP1-GFP after tetracycline induction. The cells were also transiently transfected to express the anti-GFP nanobody (nb)-APEX2-mCherry construct. The cells were then fixed with 2,5% glutar aldehyde, 2 mM CaCl2, and 2% sucrose in 0.1 M Na-cacodylate; imaged in FLM; oxidized with 2.0 mg/ml DAB for 20-40 min; treated with 1% K4[Fe(CN)6], and 1% OsO4; dehydrated in a graded ethanol series; embedded in Agar100, and sectioned to a thickness of 70 nm.
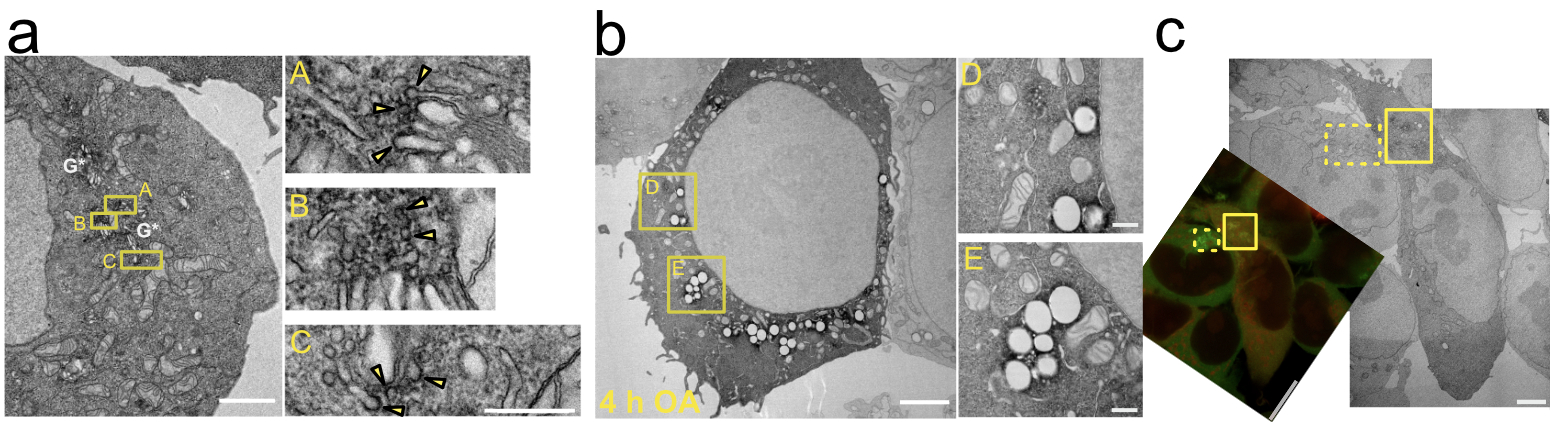
The ArfGAP1, visualized by the electron-dense DAB precipitate, is clearly present around several peri-Golgi buds (judging by their size of approximately 65 nm) and vesicular tubular profiles (VTPs), see figure 1(a). The DAB precipitate co-localized with around LDs. Both the general number of LDs and the level of ArfGAP1 around them increase with time after OA treatment time up to 4 h, see figure 1(b). It is also clear that the cells where mCherry and GFP co-localized were the same cells where the DAB contrast could be seen at the same location, figure 1(c).
Figure 1. (a) The DAB precipitate co-localizes with ArfGAP1 at Golgi (G*) buds and VTPs (yellow arrows). Scale bar on the left is 2 µm, and for the images on the right 400 nm. (b) The DAB precipitate co-localized with ArfGAP1 around LDs. The general number of LDs and the level of DAB precipitate around them increase with OA treatment time up to 4 h. Scale bar on the left is 3 µm, and for the images on the right 500 nm. (c) The co-localized mCherry and GFP (yellow fluorescence) is corresponded by the contrast from the electron-dense DAB precipitate in the TEM images, while the adjacent cell lacking the mCherry (green fluorescence) displays no DAB contrast in the TEM image. The yellow rectangles denote the same areas. Scale bar on the left is 10 µm, and for the images on the right 3 µm.
Using this technique, we have imaged ArfGAP1 around both peri-Golgi buds and adjacent VTPs, with a spatial resolution <10 nm. With the resolution possible in TEM, it is clear that the ArfGAP1 is located both around both the neck and the bulb of the Golgi buds as well as along the full perimeter of said VTPs. We have confirmed the translocation of ArfGAP1 from the Golgi area to lipid droplets after OA treatment, with ultrastructural resolution. By CLEM, we can clearly see that even for a cytosolic protein like ArfGAP1, it is clear that where the nanobody (labeled with mCherry) co-localizes with ArfGAP1-GFP, the electron-dense DAB precipitate is present in the TEM images.
In conclusion, due to the small sizes of the anti-GFP nb-APEX2-mCherry construct the DAB reaction product, this in situ method for specific protein labeling for TEM takes full advantage of the resolving power of the TEM. We can image protein of cytosolic proteins with much greater precision that with FLM only, or with IgG-based immunolabeling. With this method, the intracellular location of potentially any soluble GFP-tagged protein can be visualized in TEM.[4]
- References
[1] SS Lam et al, Nat Methods 12(1) (2015) p. 51-54.
[2] MA de Beer et al, Histochem Cell Biol 149 (2018) p. 261-268.
[3] J Gannon J et al, PLoS ONE 9(11) (2014) e111309.
[4] The authors gratefully acknowledge funding from Swedish Foundation for Strategic Research, "Research Infrastructure Fellow" under grant number RIF14-0079.